Black Summer bushfires
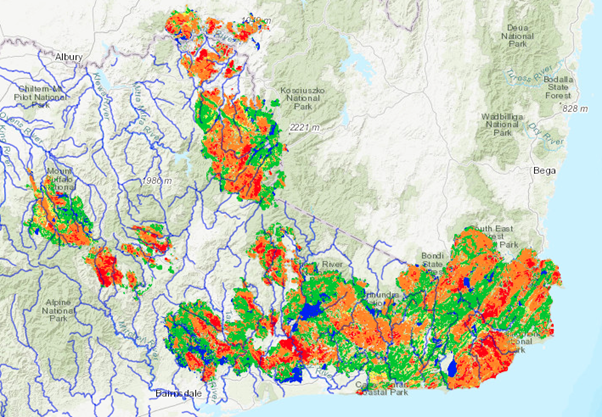
The Black Summer bushfires of 2019 and 2020 burnt over 1.5 million hectares in North-East Victoria and East Gippsland. Scientists used our monitoring network to assess the damage to rivers and streams.
Summary of severely impacted water quality
- Dissolved oxygen dropped to lethal levels on the first flush of sediment. following fires. Lethal levels and fish deaths were observed in locations such as Snowy River, Bundara River, and Mitta Mitta Rivers.
- 13 sites recording the highest or near highest levels of total phosphorus on record, including bioavailable forms contributing to algal blooms.
- 19 sites recorded record high levels of turbidity.
- 11 sites recorded record high levels suspended sediment.
- The amount of sediment moving in the Murray River upstream of Lake Hume is now about 10 times greater than prior to the fires.
How can bushfires affect water quality?
- The loss of vegetation and the baking of soils directly increase water run-off in the catchment post-fire.
- Runoff from burnt catchments following rainfall events can lead to the movement of soil and ash, carrying nutrients, metals, and salts.
- This sediment can blanket the bottom of the rivers and streams, covering habitat for bottom-dwelling organisms, many of which are food for fish. It also covers any algae or aquatic plants living at the bottom, hindering photosynthesis, and potentially killing the plants and algae.
- Subsequent rainfall events not only move more soil from the catchment but can disturb the sediment already in the streams from the previous rainfall events. This causes an increase in turbidity in the river or stream.
- High turbidity loads in the water column can clog fish gills, potentially leading to their death. High turbidity loads also stop light penetrating the water column, inhibiting photosynthesis. This not only affects aquatic plants and algae living on the bottom of the river or stream, but also on the algae living in the water column decreasing the productivity of the system. High turbidity loads also make it more difficult (and expensive) to treat water for drinking, including blocking diverter pumps.
- The soil and ash coming off the catchment following fires tends to be rich in nutrients, particularly nitrogen and phosphorus. In some cases, the nutrient concentration in rivers and streams can be hundreds of times higher after fires than before the fires.
- If concentration of nutrients is too high, it can lead to algal blooms. Algal blooms are harmful because they can strip oxygen out of the water column during the night, leading to fish deaths. In the case of blue-green algae, the blooms can be toxic. The formation of algal blooms is not usually a problem in the rivers and streams immediately post-fires. This is because the high turbidity limits the amount of light in the water column keeping algal growth limited. Algae can become an issue when the turbid, nutrient rich water slows down. This occurs either when it reaches a dam or weir, or when it reaches an estuary. As the water slows down, the sediment drops out, improving the light climate in the water column.
- Bushfires result in metals and metalloids movement in the environment. Metals include iron, copper, zinc, chromium, lead, manganese, and arsenic. Arsenic and mercury are of particular concern for the Murray River due to extensive legacy gold-mining activities in the river’s upper-catchment during the second half of the 19th century and the beginning of the 20th century. Iron and manganese mobilised following bushfires can interfere with water treatment for human consumption.
- The fall in dissolved oxygen is caused by bacteria in the receiving water consuming dissolved organic carbon (DOC) from organic debris. The DOC is leached from the soil or from unburnt plant material washed into the river following rain. Bacteria use this DOC as a food source, consuming oxygen in the process.
- Increases in electrical conductivity are caused from salts leaching from the mobilised soil, and from ash generated by the fires.
What did we learn?
The key points that come out of this study are:
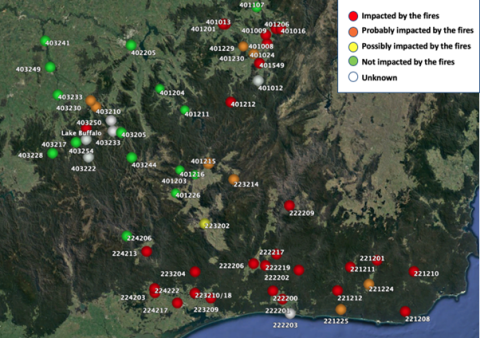
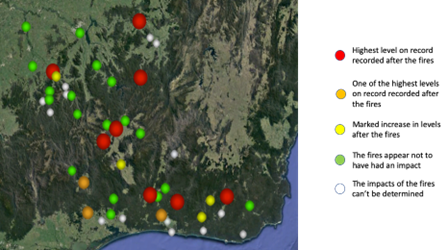
- 59 sites were analysed for water quality. 36 sites (over 60%) of sites where water quality data is collected in northeast Victoria and Gippsland had poor water quality following the Black Summer fires.
- Some sites were badly impacted. For example, the amount of sediment moving in the Murray River upstream of Lake Hume is about 10 times greater now than prior to the fires.
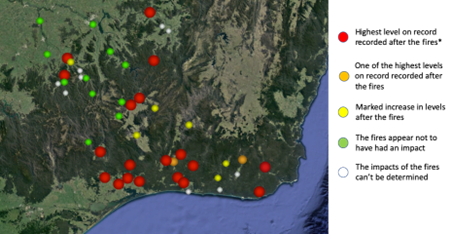
- Water quality in some sites has improved since, these sites are mostly in the uplands.
- Some sites in both Gippsland and the North-East will likely experience poor water quality following future rainfall events.
- There were 15 sites with no evidence of impact on water quality. Not all sites where water quality data is collected had evidence of poor water quality following the fires. Some of the sites didn’t have fire in their sub-catchment, but some were protected from impacts due to upstream dams. The dams intercepted some of the sediments and helped dilute the dissolved constituents.
- There were 2 sites where water quality was possibly impacted.
- There were 6 sites where the water quality impact couldn’t be assessed because of data issues.
What contributed to poor water quality?
Turbidity, total suspended solids, nutrients (nitrogen and phosphorus), dissolved oxygen, electrical conductivity, and metals were analysed. Learn more about these water quality parameters.
Turbidity increases
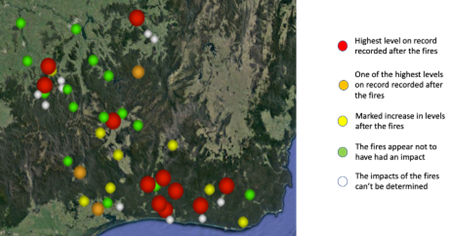
Turbidity levels increased at many sites, especially within river valleys in Gippsland. Only one site in the Gippsland region wasn’t impacted by increases in turbidity. The site that wasn’t impacted was on the Wonnangatta River and this part of the basin was not burnt.
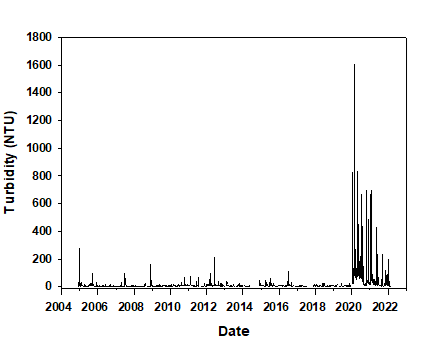
An example of the increased turbidity from the Black Summer fires can be seen on the Tambo River at Battens Landing (Site ID 223209). In the 15 years prior to the fires the highest turbidity had been approximately 200 NTU. Post-fire turbidity peaked at approximately 1600 NTU. The turbidity impacts from the fires were still seen at the end of 2022.
Total suspended solids increase
The impact of total suspended solids mirrored the turbidity levels increases seen at many sites, especially within river valleys in Gippsland.
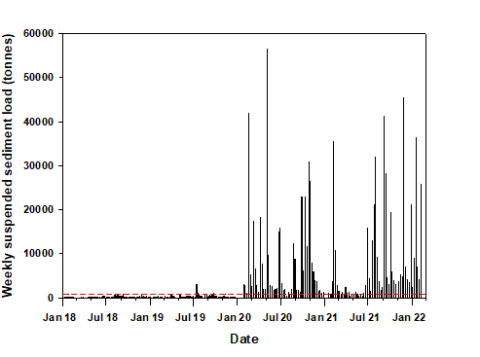
The suspended solids loads were able to be calculated at some sites. Loads give a better understanding of if conditions are improving over time. Post-fires the suspended solids loads in the Murray River at Jingellic (Site ID 401201) are orders of magnitude greater than the long-term average. The loads at the end of 2022 are still like the levels observed immediately post-fires. This suggests that suspended sediments will be seen at this site for a prolonged period. The weekly suspended solids loads in tonnes at the Murray River at Jingellic from January 2018 until March 2022, can be seen in the figure below. The red dashed line near the bottom of the graph represents the long-term average loads for this site.
Nutrients
Nitrogen
Two forms of nitrogen are measured across northeast Victoria and Gippsland. NOx (the sum of nitrate and nitrite, which are both dissolved forms of nitrogen) and total Kjeldahl nitrogen (TKN).
TKN was high in the Snowy River catchment, where values of up to 15mg/L were recorded. The impact of TKN was less in much of the remaining region.
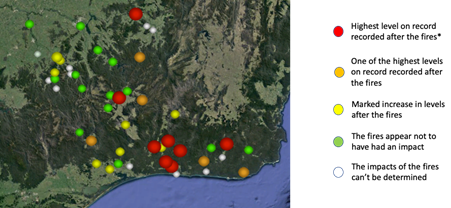
Nitrate was recorded by spot measurement. Nitrate concentrations were high throughout the Gippsland rivers, with many sites recording the highest or near highest concentrations in the months post-fires.
Phosphorus
Two forms of phosphorus are measured across northeast Victoria and Gippsland. Total phosphorus (TP) and filterable reactive phosphorus (FRP). FRP is a measure of how much dissolved phosphorus there is in the water column. FRP is the form most readily available to algae and other aquatic organisms.
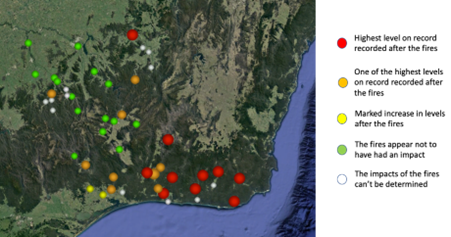
Phosphorus is often associated with high levels of turbidity. This was found post-fires, with 13 sites recording the highest or near highest levels of TP on record.
Many of the sites that recorded high levels of TP also recorded high levels of FRP. Algae levels were not investigated as part of this study.
Dissolved oxygen
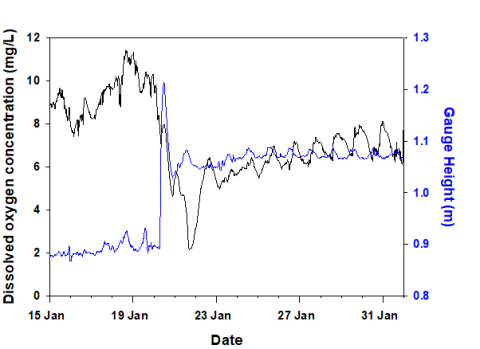
Dissolved oxygen (DO) dropped to very low levels in northeast Victoria and east Gippsland. Large native fish species can become stressed at levels less than 4mg/L and die at levels less than approximately 2mg/L.
The Snowy River at Orbost (Site ID 222201) experienced a significant drop in DO following the first flush of the fire impacted field areas in January 2020. DO levels dropped from approximately 10mg/L to approximately 2mg/L.
After the first flush NSW fisheries staff measured very low DO levels, with some measurements approaching zero on occasion in Mannus Creek, a tributary of the Tooma River. Similarly, North East Catchment Management Authority Water Watch volunteers measured low levels (less than 10% saturation) in the Bundara River, a tributary of the Mitta Mitta River upstream of Dartmouth Dam at the same time.
Electrical Conductivity
Electrical conductivity EC impact was patchy across northeast Victoria and Gippsland. Short-lived impacts were seen at Cann River upstream of the offtake (Site ID 221224).
Metals
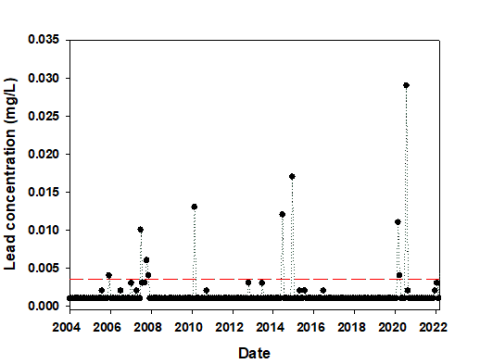
Metals are measured at one site on the Snowy River, namely Snowy River at Jarrahmond (Site ID 222200). Post-fires concentrations of arsenic, copper, lead, and nickel were highest or near highest on record. Concentrations of copper, lead, nickel, and zinc exceeded the national standards at times. No long-term impacts are expected due to the exceedance being short-lived.
Reviewed 11 June 2024