The quality of water affects what we can use it for, such as drinking, recreation, agriculture, cultural uses, and supporting our ecosystems’ health.
Every 5 years, the Victorian government commissions a study on the quality of water in the state’s rivers, streams, and reservoirs (surface water). Researchers analyse data from across the state to determine how Victoria’s water quality may be changing. The researchers assess water quality using the following measures:
• salinity: how salty the water is, as described by electrical conductivity.
• turbidity: how cloudy the water is.
• phosphorus and nitrogen: how much of these nutrients are in the water. These 2 types of nutrients are important for plant growth, but in excess can cause algal blooms.
• pH: how acidic or alkaline the water is.
• dissolved oxygen concentration: how much oxygen is in the water, which is important for aquatic species.
New study
This latest study examined water quality across Victoria at 137 monitoring sites. These sites represented varying environmental conditions. To understand how water quality changes, the study included 27 years of data from 1995 to 2021.
Researchers also examined how climate change and climate variability are likely to impact water quality in the future, how bushfires impact surface water quality, how blue-green algal blooms change over time, and what we can learn with new types of water quality data.
Water quality varies across Victoria
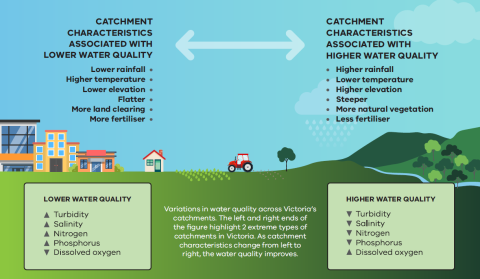
The study found water quality is better in the cooler, mountainous, forested regions in the east of Victoria when compared with urban areas and the warmer lowland agricultural and cropping regions. In the warmer, flatter and more developed areas, surface water generally has higher levels of salinity, turbidity, phosphorus, nitrogen, and pH, with lower dissolved oxygen levels.
Water quality changes during wet and dry periods
During extended rainy periods, water quality can change as catchments and riverbanks erode and as fertilisers, animal wastes and other materials are washed into rivers. Salinity in rivers is also diluted during extended rainy periods. Over the last 27 years during wetter periods there was an increase in turbidity, phosphorus and nitrogen, and dissolved oxygen. In drier times, turbidity, total nitrogen, and total phosphorus levels reduced. During dry conditions, salinity and pH rose. During the many dry years of the Millennium Drought, there was a significant rise in salinity across most sites. We expect these patterns will repeat during extended dry periods under climate change.
Bushfires can decrease water quality
Bushfires, particularly large and intense ones, can badly affect water quality. The impacts can last well after the events, sometimes for years. The formation of ash, loss of vegetation, and changes to soil during a bushfire allow large amounts of soil and ash to wash into waterways with the rains that follow. The 2019-20 bushfires in Gippsland and Victoria’s north-east led to some of the worst water quality values on record, and effects were noticed more than 2 years after the events in some places.
Blue-green algal blooms affect reservoirs and waterways
Blue-green algae naturally occurs in waterways. But under the right conditions it can rapidly increase and form algal blooms. Some algal species produce toxins posing health risks to swimmers, livestock, wildlife, and pets. Blue-green algae is monitored in our large water storages that are commonly used for recreation. This study examined 16 water bodies in Victoria and did not find an increase or decrease in blue-green algae events overall. With more data, scientists will continue to learn more about why and when blue-green algal blooms happen and how best to avoid or prepare for them.
Where to from here?
The findings of this report will support the development of Victoria’s state and regional water management strategies. We will keep monitoring our long-term sites to allow us to continue to understand our water quality. By continuing to use new technologies, such as water quality probes and satellite imaging, we will better understand short-term water quality events and how water quality changes over time. Future work will continue to research how climate change will impact water quality.
Find out more at where you can find the Victorian Water Quality Analysis 2022 Summary Report, Technical Report and Time Series reports.
Reviewed 11 June 2024
