
General Tips
Using WMIS without a mouse, using your keyboard
Use the ‘tab’ key to move across the headers. If you need to move backward hold down the ‘shift’ key and then use the ‘tab’ key.
Once you arrive on the area you want to use, other keyboard features can be used, such as typing into the search. The ‘enter’ button activates your selection. Where applicable ‘enter’ will also deselect your chosen option.
What if I get lost in my searching?
There is a restore default behaviour button in the top right corner. Left 'mouse-click' on the button to reset.
What if I accidentally close a graph or table that I’ve been working on?
Never fear, simply left 'mouse-click' on the go back button on the website ribbon. You may need to click on it more than once.

Selecting sites
Selecting more than one site on a map

Add one site at a time
Left ‘mouse-click’ and drag to move around the map viewing area.
To select a site, left ‘mouse-click’ on it. To select multiple sites, hold down ‘shift’ key and left ‘mouse-click’. If you accidentally select one and need to deselect hold down ‘shift’ key and left ‘mouse-click’ on it again.
Add multiple sites in a distinct area
Choose from the various options within the select (hand) button by using a left ‘mouse-click’ on the button. In addition to the single select option, there are the options to select by rectangle, by circle and polygon. Left ‘mouse-click’ on the relevant button to activate it, then left 'mouse-click' on the desired map area and drag to select an area.


Using favourite sites
Some users are only interested in data for a handful of designated sites. Select these sites as per the above instructions and then click the add to favourites (star) button to save to favourites. Favourites are easily reset. For users with more than a handful of sites, it may be necessary to flush your sites, which will remove all 'favourites'. Remove your favourites using a left ‘mouse-click’ on the flush favourites button.


Then save your current selection as 'favourites'.
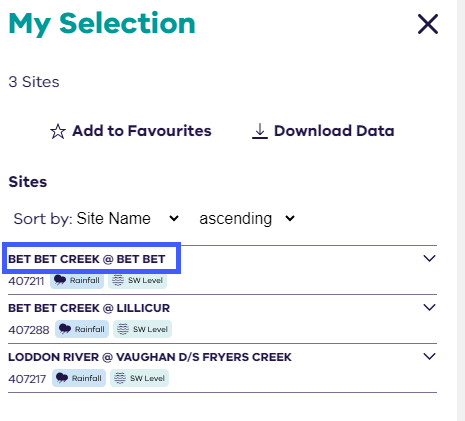
Viewing your selection
Once you’ve selected your sites on the map, use the 'show selection' (eye) button to view the selection in the left sidebar.


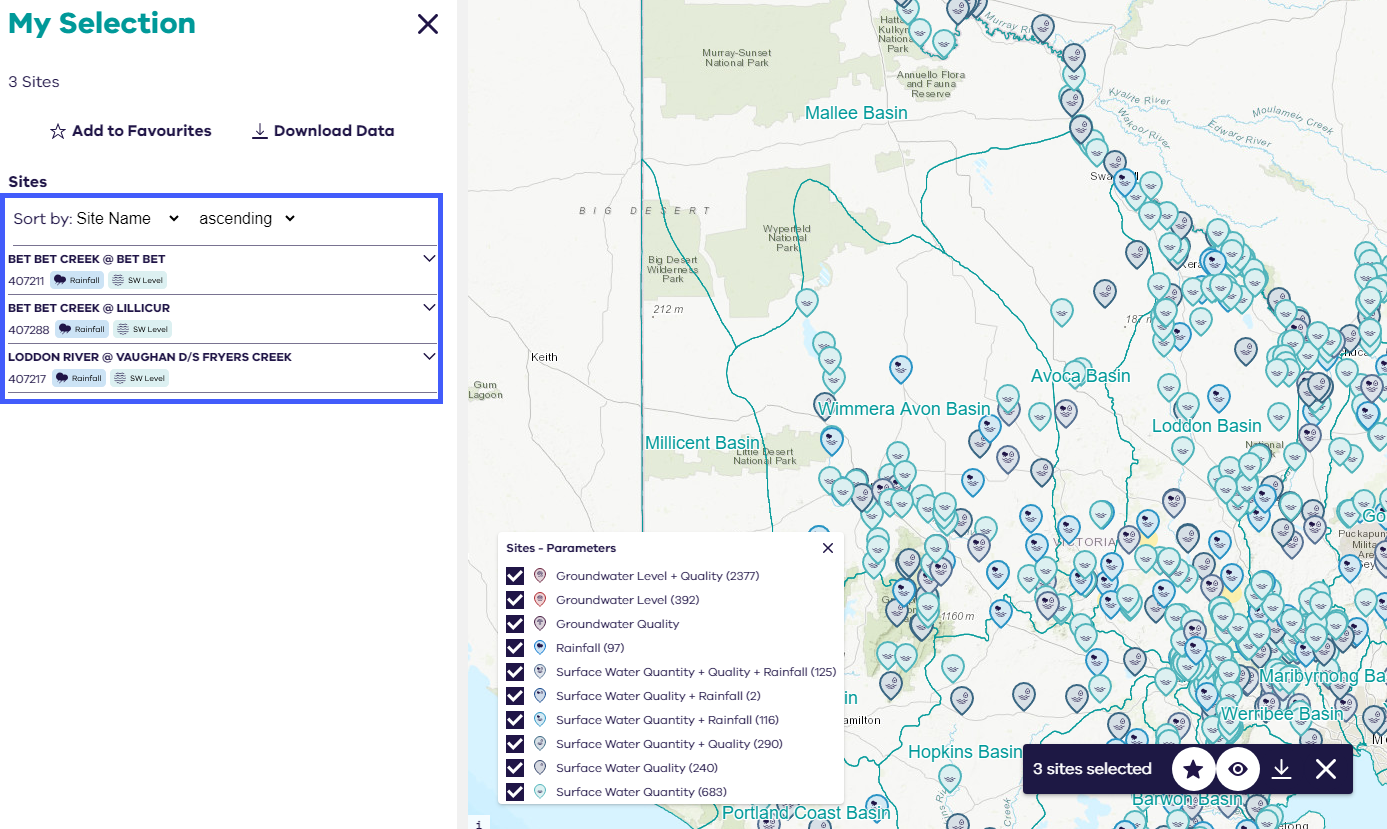
If you’re happy with your selection it can be helpful to ‘add to Favourites’ which you can do either by left ‘mouse-click’ on the star button on the map, or by left ‘mouse-clicking’ add to Favourites on the left sidebar.
***ADD IMAGE***
Now we will focus on the dropdown arrows on the left sidebar.
On the right-hand side of each ‘site name’ you will see an expander arrow.
Left ‘mouse-click’ on the expander arrow to expand the site to view its monitoring data. Data is sectioned into:
• Continuous data
• Spot Level/Flow Data
• Spot Water Quality Data
• Atmosphere Data
• Spot Metals Data
as it pertains to the selected Site.

You can close one section at a time or close all data for a site by selecting the collapse arrow button located beside the site name.
Graphing tips
Graphing multiple parameters on a graph
Once you have you used the eye button for your site selection you can quickly create a graph. If you would like to graph some data from one site, left 'mouse-click' on the expander arrow.
You can now use view the data for this site and create a graph.

To commence graphing left ‘mouse-click’ on the first parameter you would like to view. In this example we want to view rainfall.
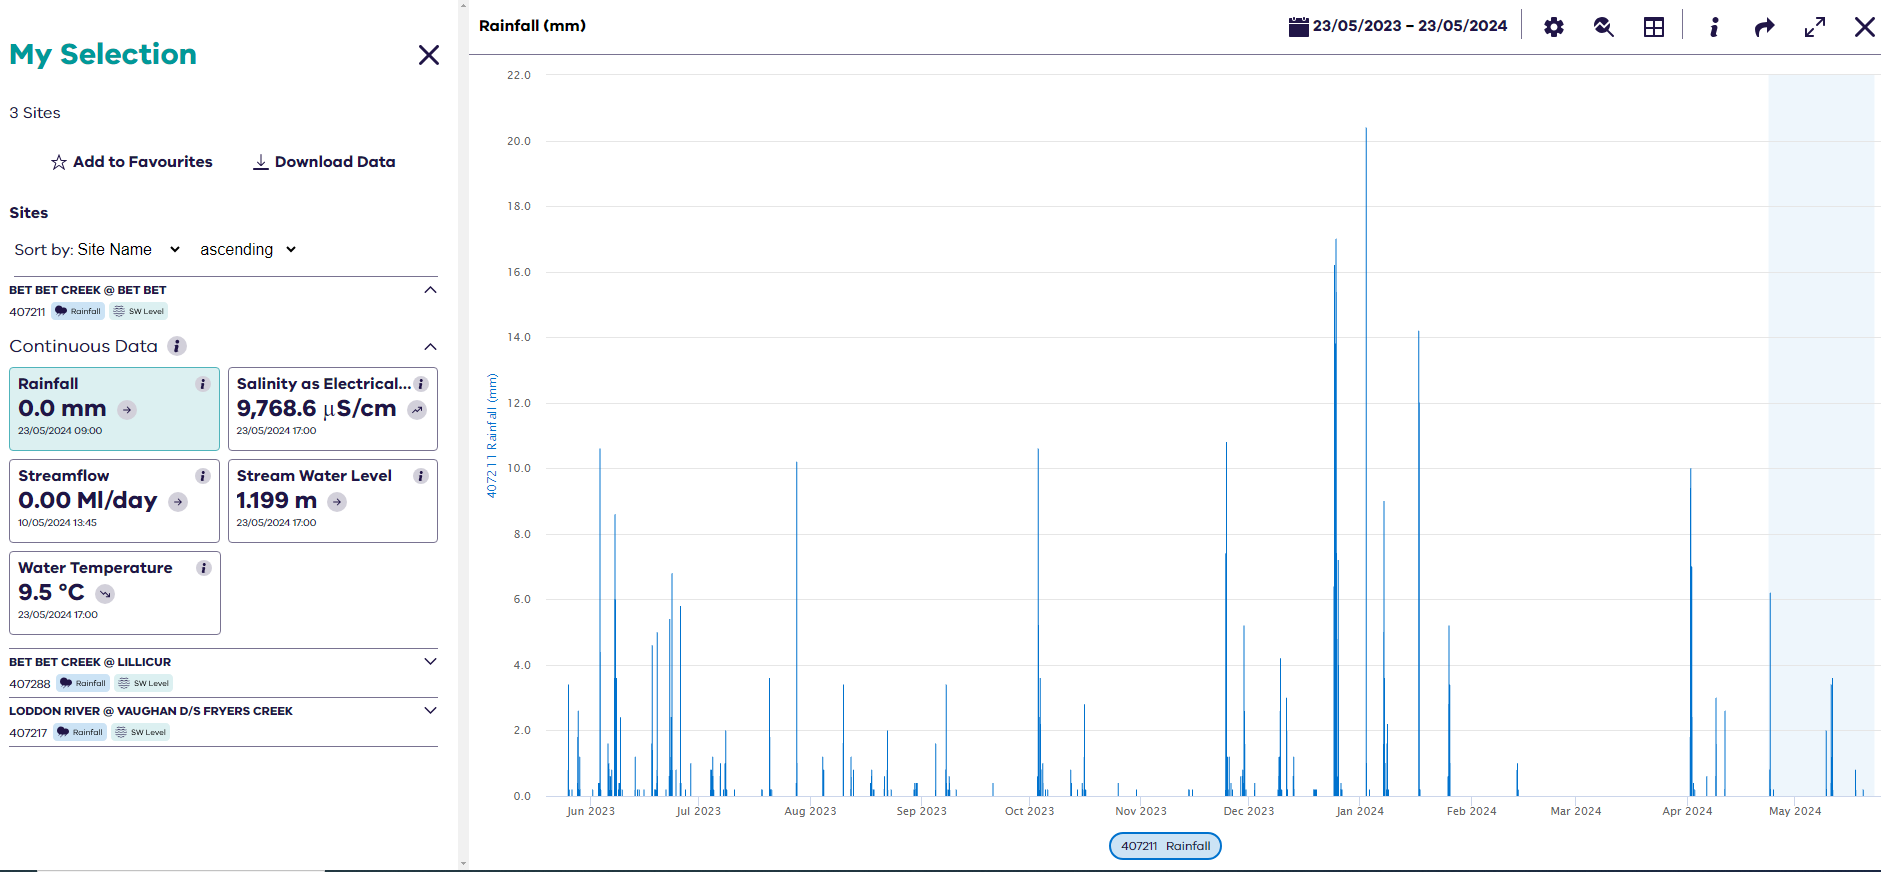
Note: The time-period defaults to ‘one year’ for surface water sites, and to ‘period of record’ for groundwater sites. To view streamflow with rainfall, left ‘mouse-click’ on the streamflow tile.
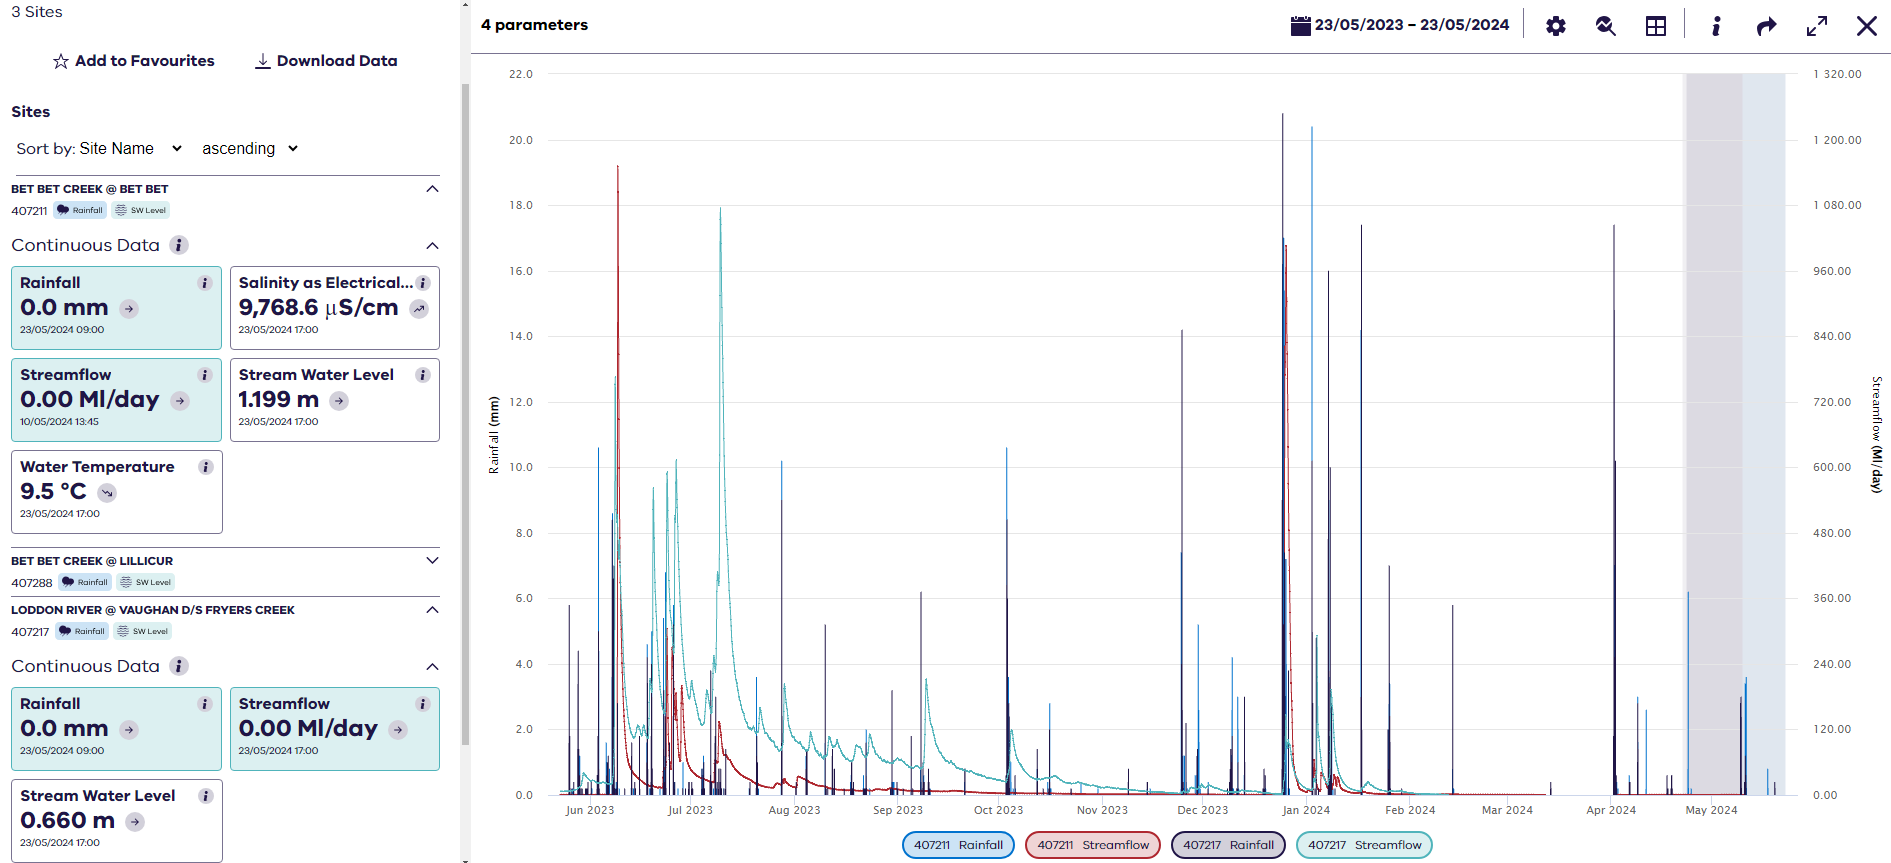
Graphing of multiple parameters (rainfall and streamflow)
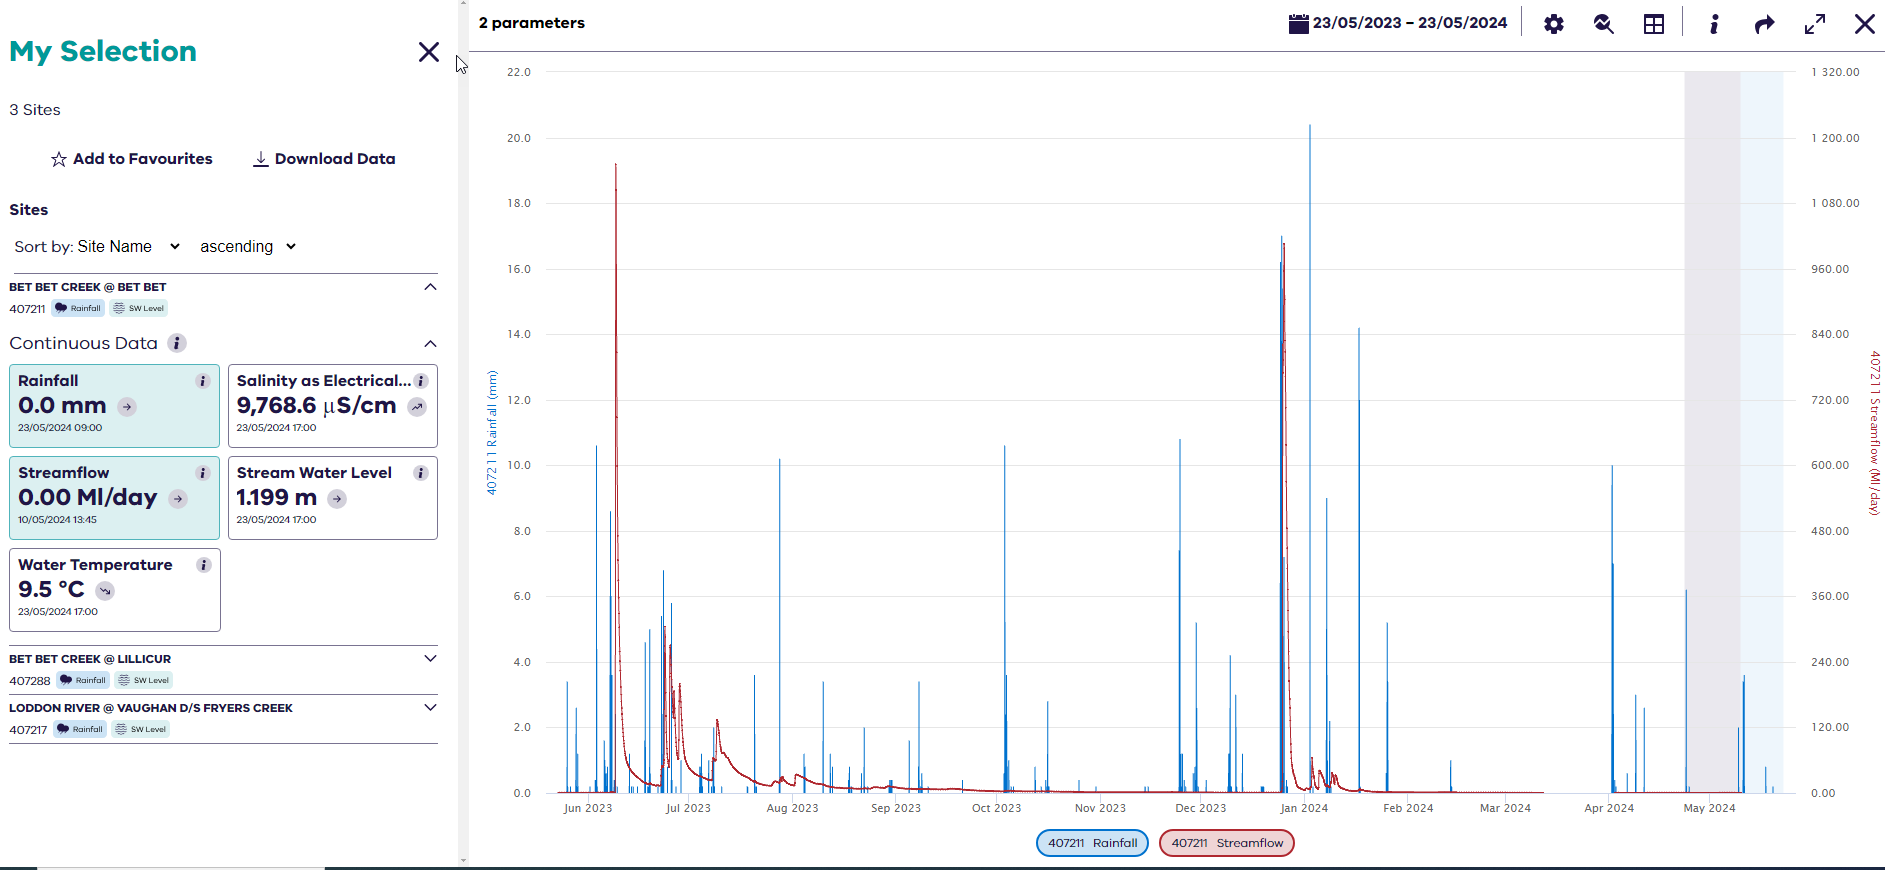
Graphing multiple sites on a single graph
To extend the graph to include additional sites, simply repeat the process for graphing above, but select another site. Left ‘mouse-click’ on the expander arrow to expand the additional site to view its monitoring data.
Add a parameter to the graph.
Graph showing one site with rainfall and streamflow, and a second site with rainfall
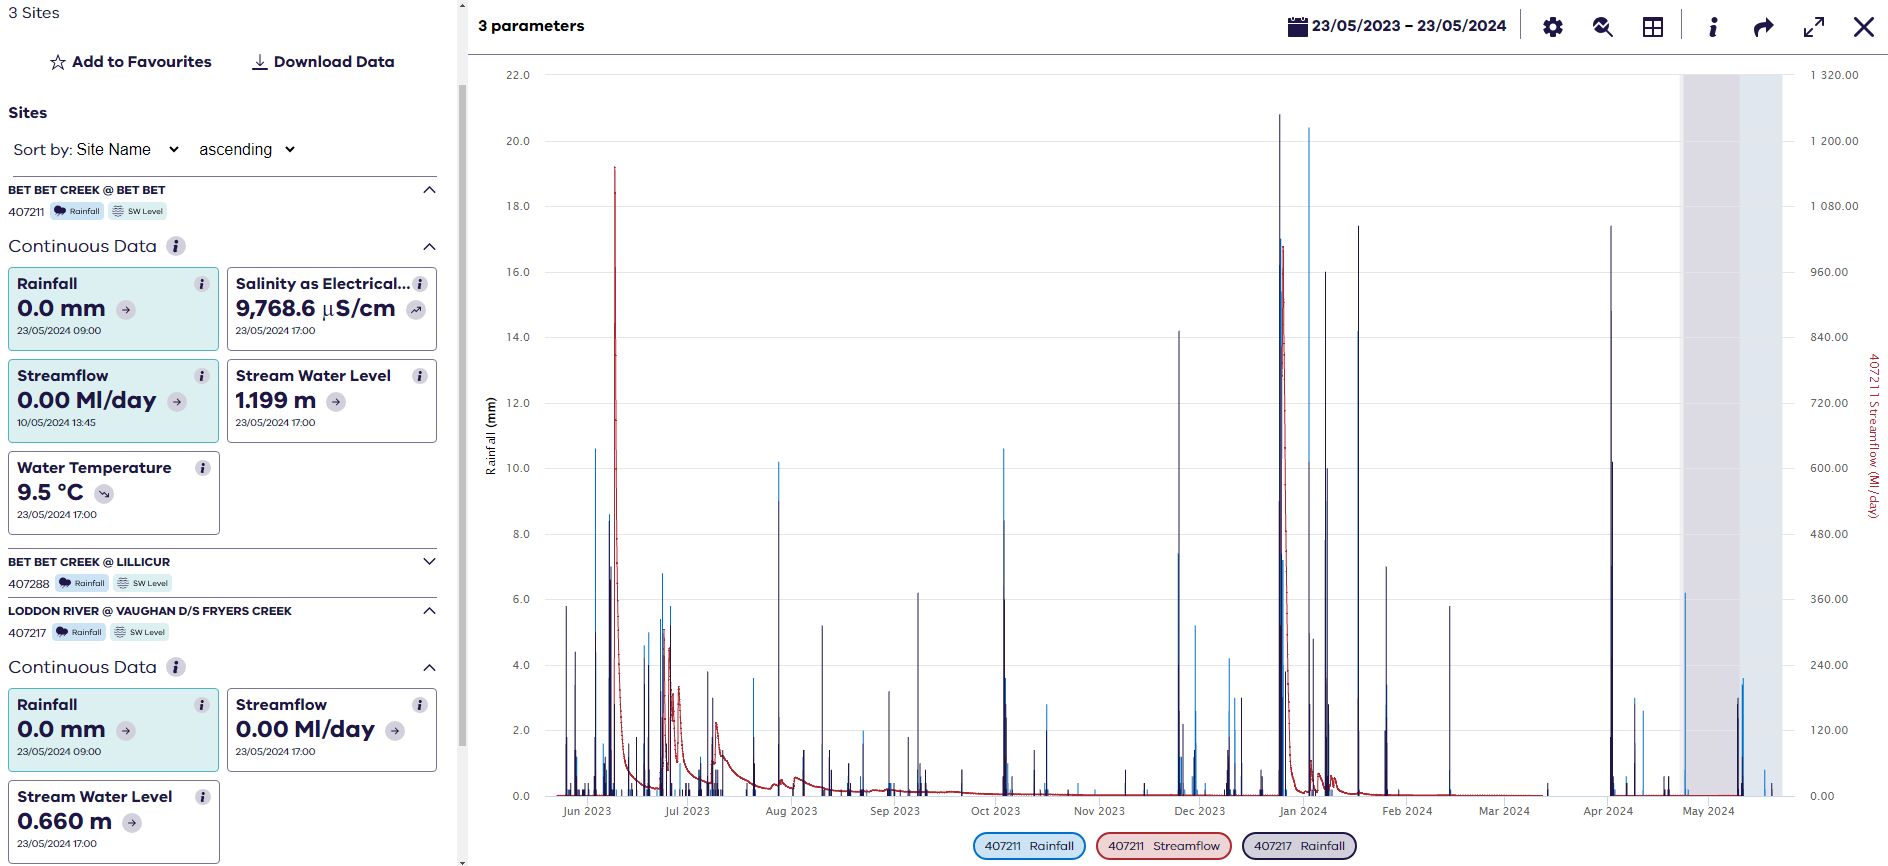
Add another parameter to the graph.
Graph of multiple parameters (rainfall and streamflow) for two sites
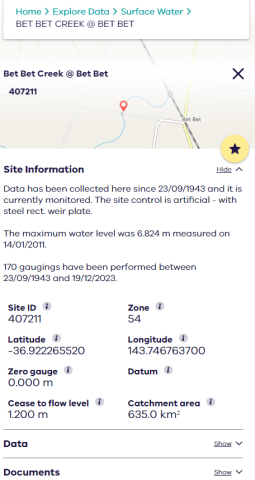
To view detailed site information and documents
Each site name is in ‘bold’ format. Left ‘mouse-click’ on the bold site name.
This expands the chosen site to provide basic site information, data, and access to various documentation.
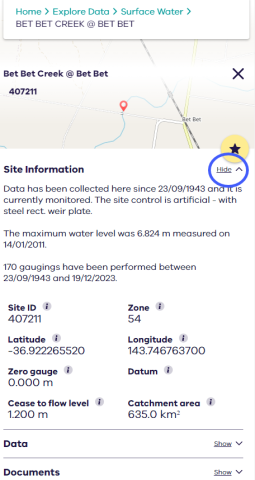
To revert to the compressed list view, left ‘mouse-click’ on the hide button.
Quick view of key surface water parameters over multiple years
There are automated daily summaries for surface water sites with continuous monitoring for:
• stream water level
• streamflow
• dissolved oxygen
• water temperature
• turbidity
• salinity as electrical conductivity.
To view these parameters over multiple years, follow instructions above 'To view detailed site information and documents' to expand the chosen site.
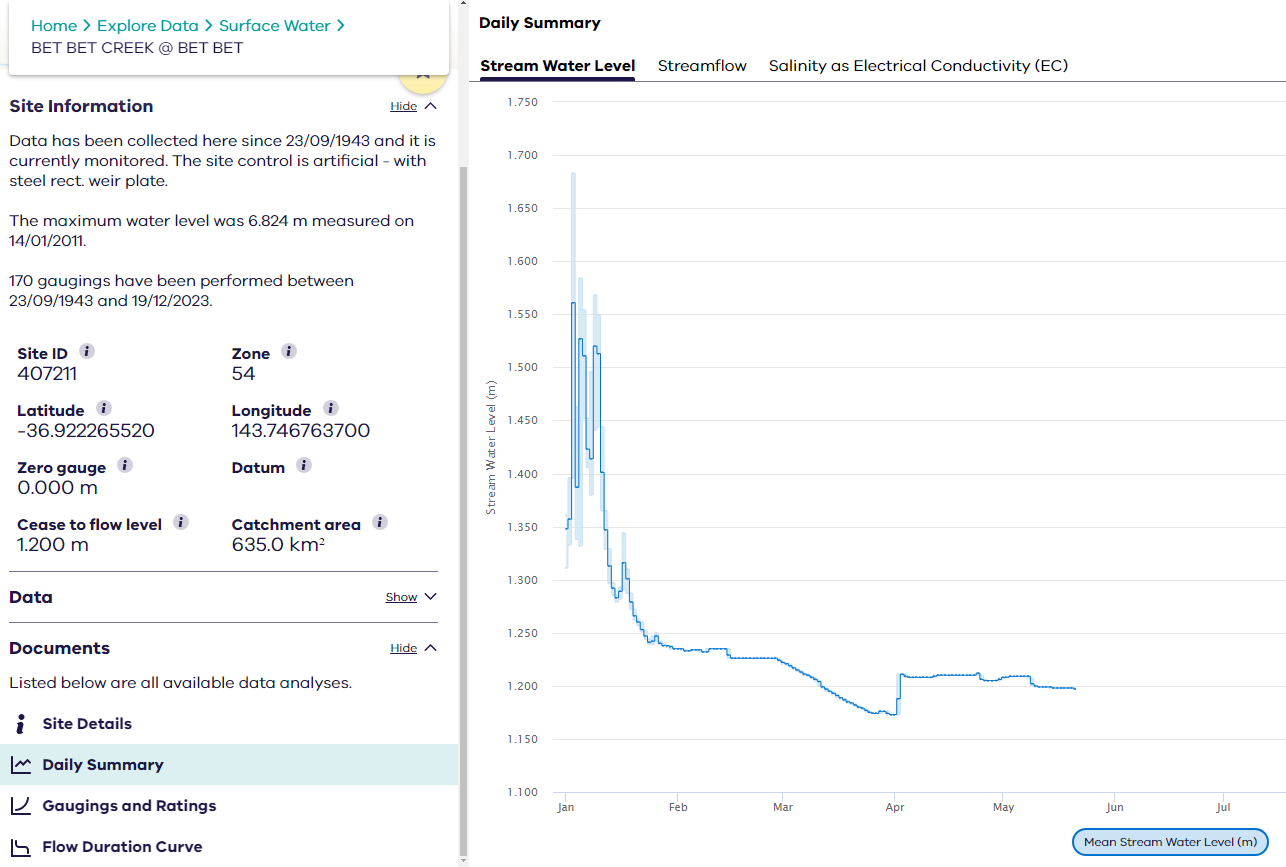
Scroll down to 'documents' and select daily summary. The graph will include tabs for any of the above listed continuous parameters that exist for this site. The graph will automatically display the current year.
Default view of daily summary with stream water level
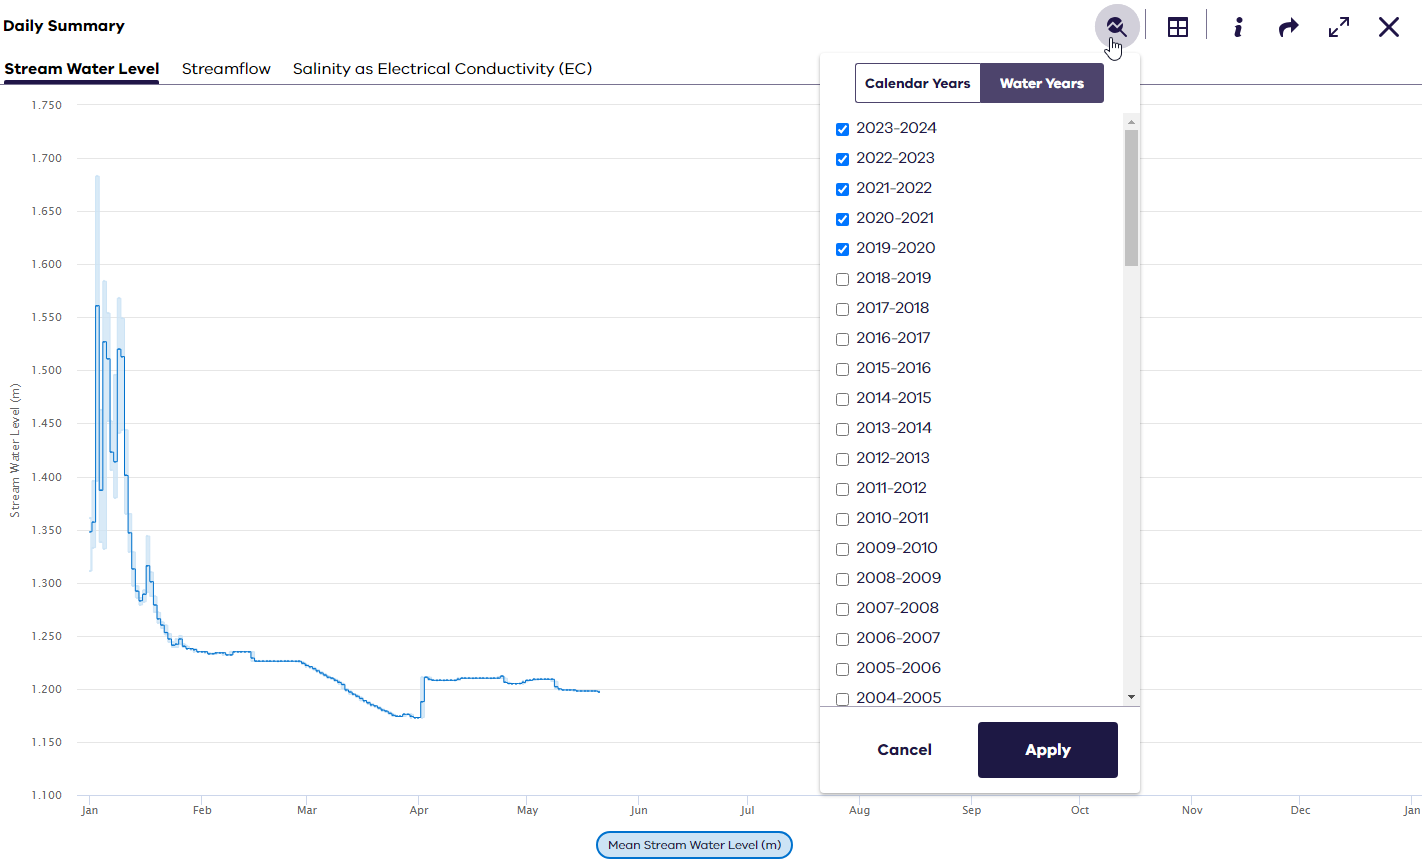
To select multiple years, or to change the graph commencement from 'calendar years' to 'water years', left ‘mouse-click’ on the choose period button. The default is 'calendar years', to change to 'water years' click on the water years button. All available years will display. Left 'mouse-click' on the desired years and then left 'mouse-click' on the apply button.
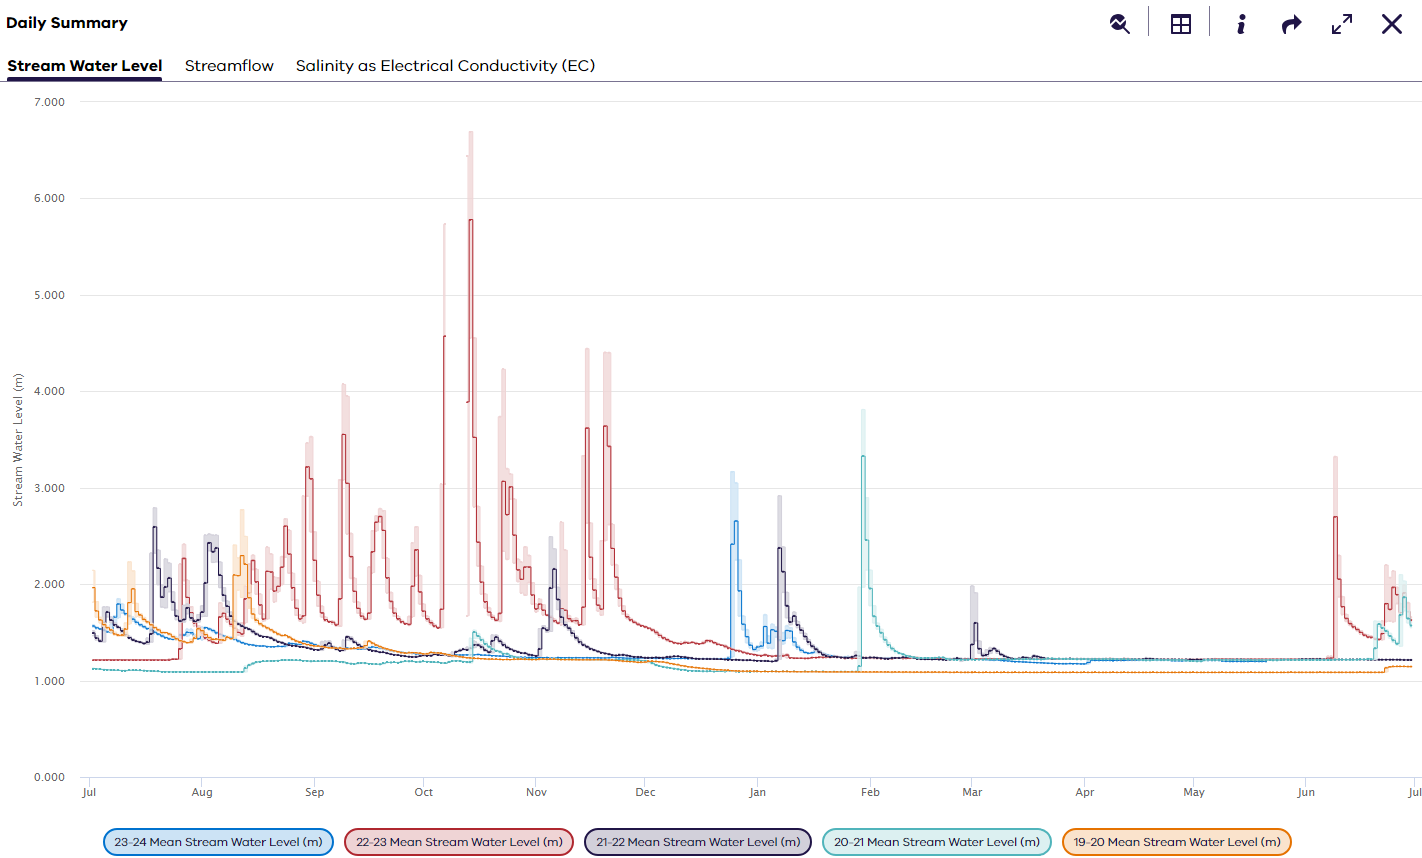
The graph legend is used to distinguish the selected years.
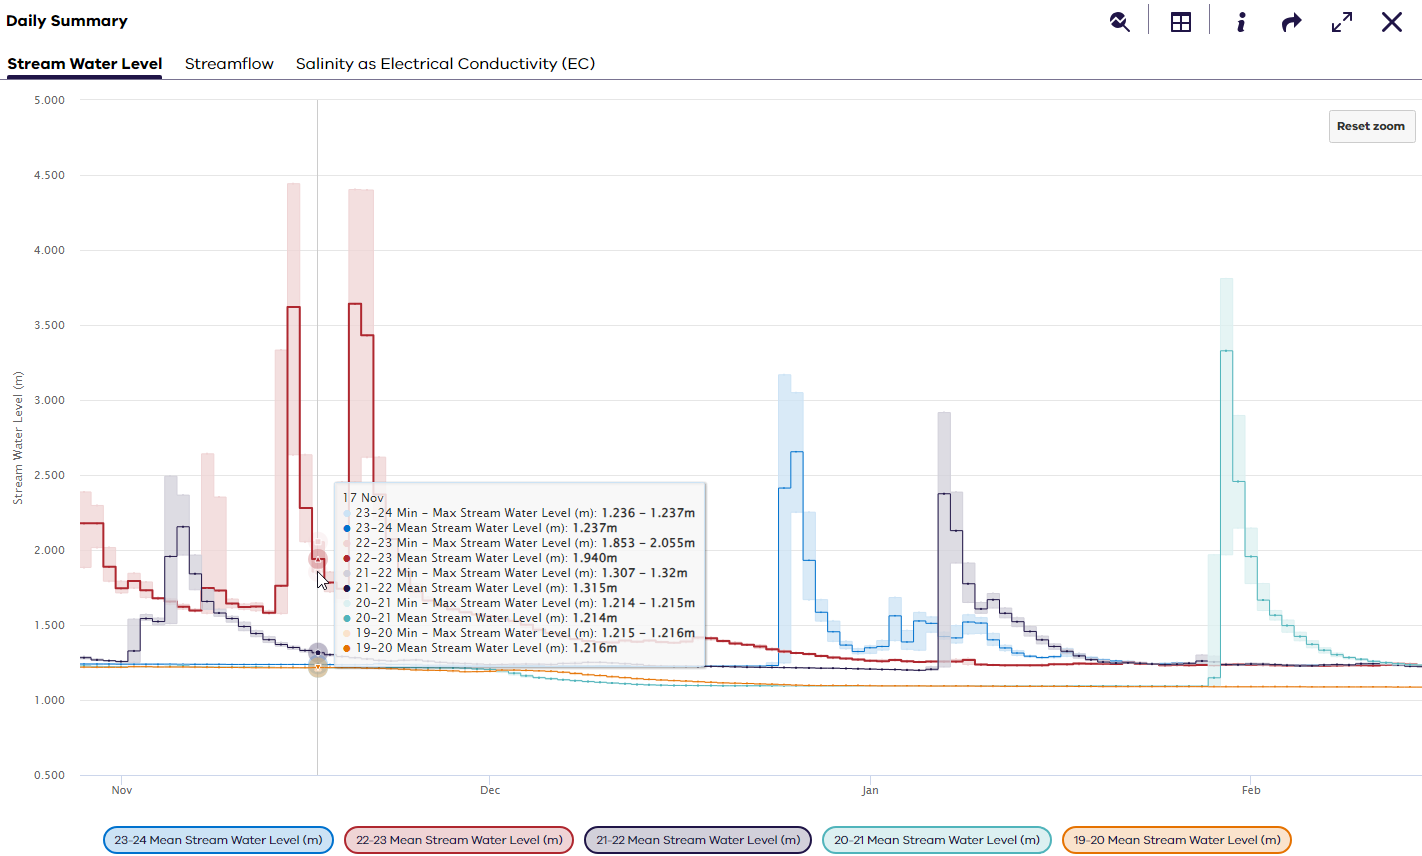
To zoom in on an area, left ‘mouse-click’ and drag to select the area. Once zoomed in you can view the ‘mean’, ‘maximum’ and ‘minimum’ for each daily period.
Zoomed in daily summary showing mean, minimum and maximum daily values
Sharing with others
There are two main ways to share views with others. Left ‘mouse-click’ on the sharing options button to view your sharing options.
Create a short URL
Left ‘mouse-click’ on create a short URL to quickly create a short address. From here you can quickly drop the URL into an email, chat or paste into a document or website. Short URL addresses are permanent, so you don’t need to worry about them not working overtime.
Embed current view
We understand that you want to look at the same thing again and again, or that you would like your stakeholders to be able to view something specific in a consistent manner. Left ‘mouse-click’ on the embed current view option to do this. An embedded code will pop up. Copy the code and paste into your internal, or external webpage. I-frames are permanent, but also dynamic. This means that when a user selects it, they start at the frame you saved, and then alter it to explore the data. If the user finds something they like, they can create a new embed current view themselves and use it somewhere else.
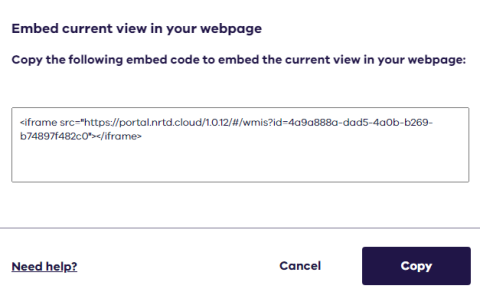
Embedding example - streamflow monitoring on a river
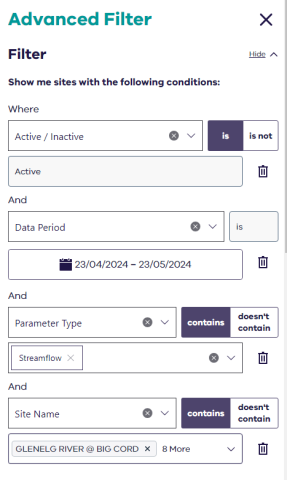
A user wants to embed some streamflow monitoring for the Glenelg River, so that stakeholders can easily view the various flows. To create this view it is important to filter ‘active sites’, ‘where results have been obtained in the 'past month’, that the continuous parameter ‘streamflow’ is present, and lastly that the site name includes ‘Glenelg River’.
The below is the resulting embedded image. It can take a bit of practice to get the embedded image to display exactly how you would like. Get in touch if you require assistance.
Downloading data
Site metadata
Downloading of tailored site metadata, can be done from the ‘table’ view.
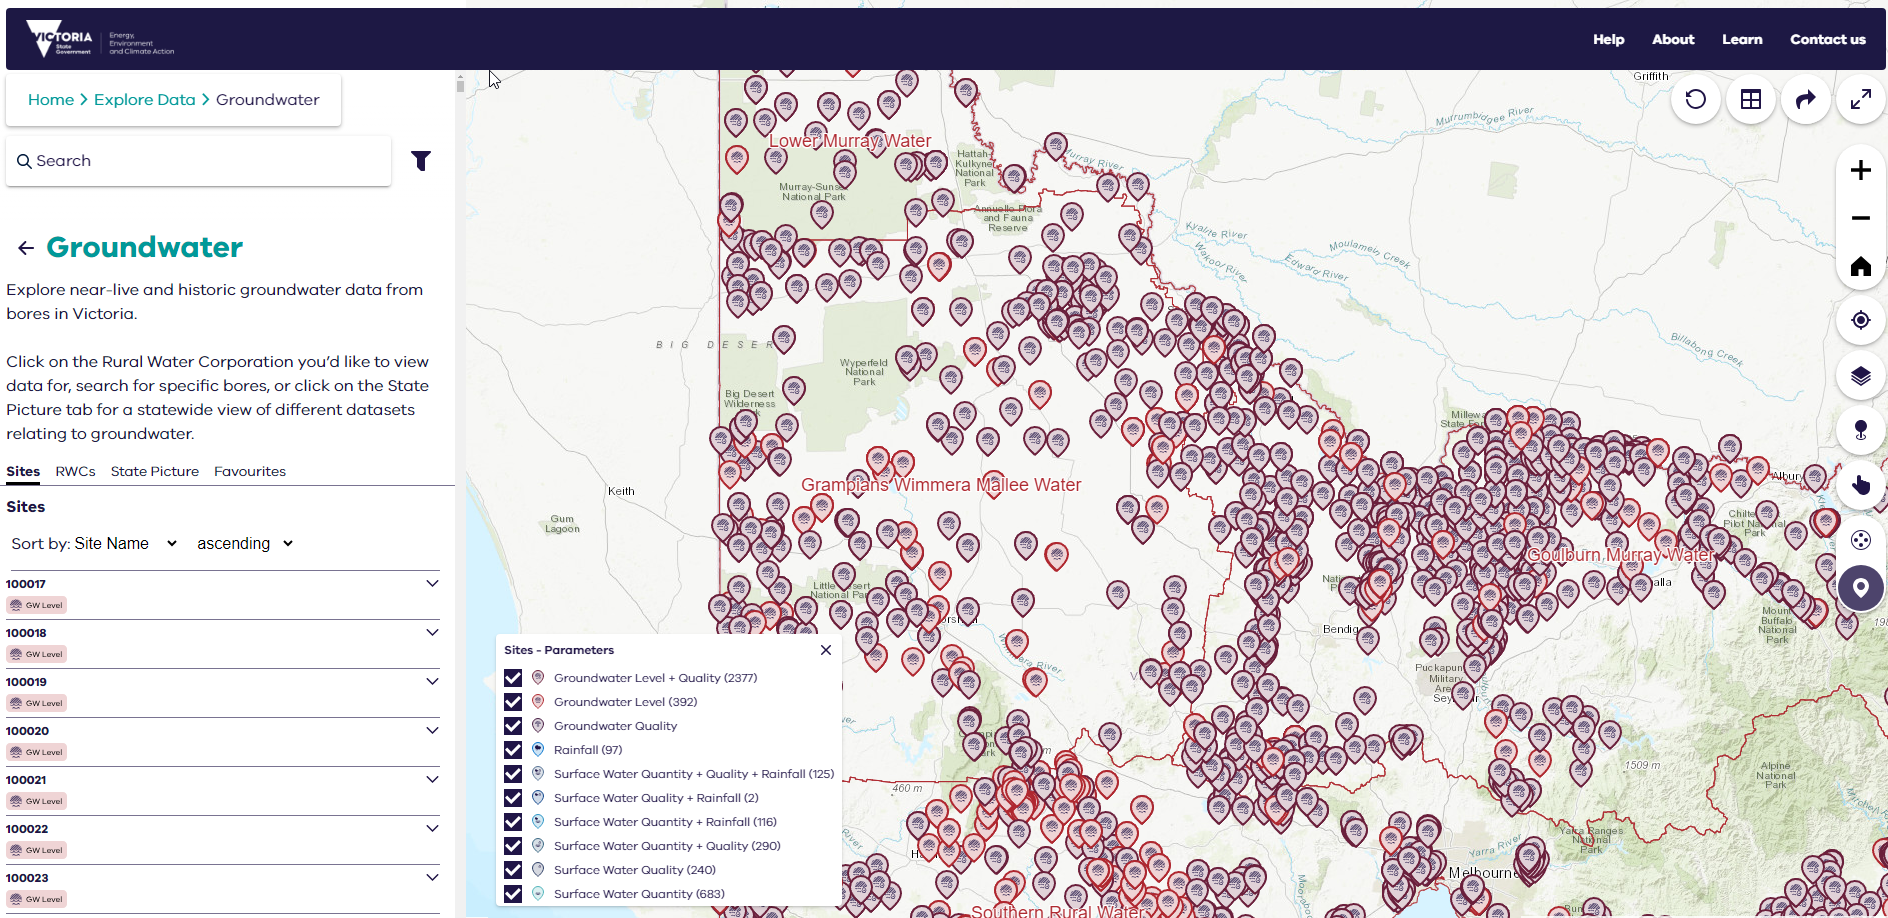
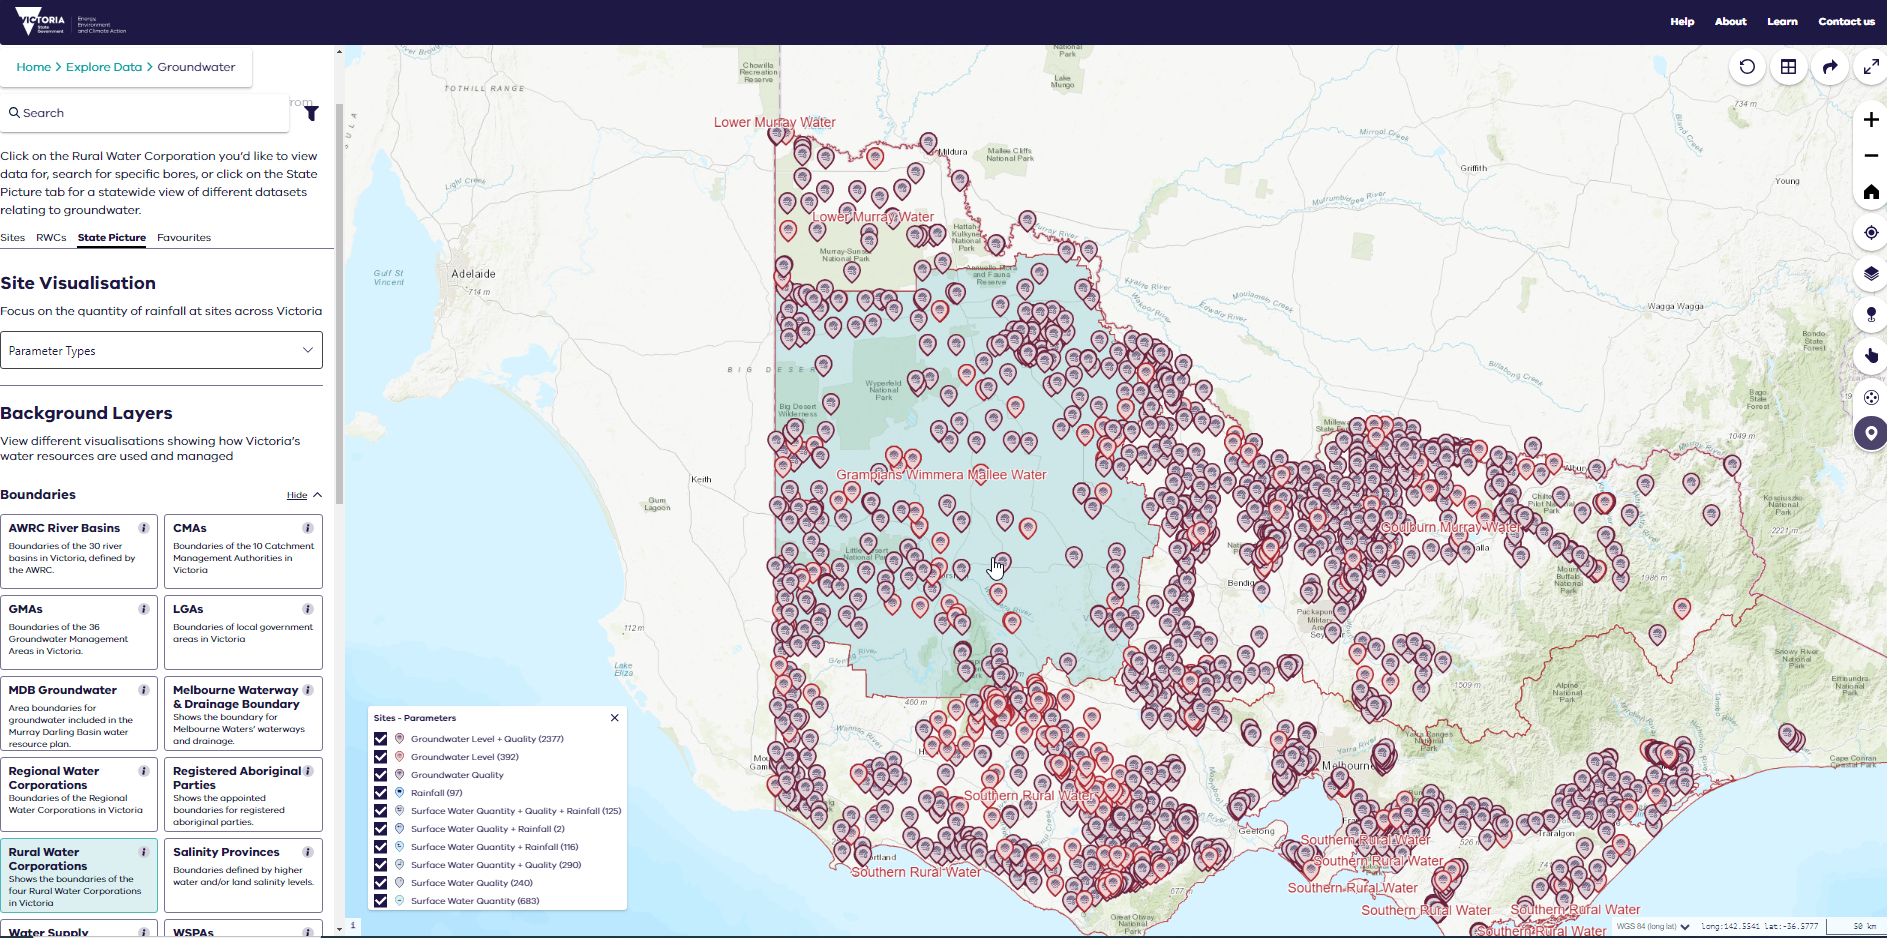
Sites can be selected in multiple ways. In this example topic cards and map layer cards are used to create the selection. For this example, the user would like specific site metadata for all groundwater sites located in the rural water corporation ‘Grampians Wimmera Mallee Water’.
Starting from the 'explore data' page, left ‘mouse-click’ to select the ‘groundwater’ topic card.

Groundwater sites will be filtered to the map view.
Left ‘mouse-click’ on the State picture tab of the left Sidebar to display the Map Layer options for groundwater. In this instance, the Rural Water Corporations tile is the default, so it doesn’t need to be selected.
State picture showing Rural Water Corporations selected as the default
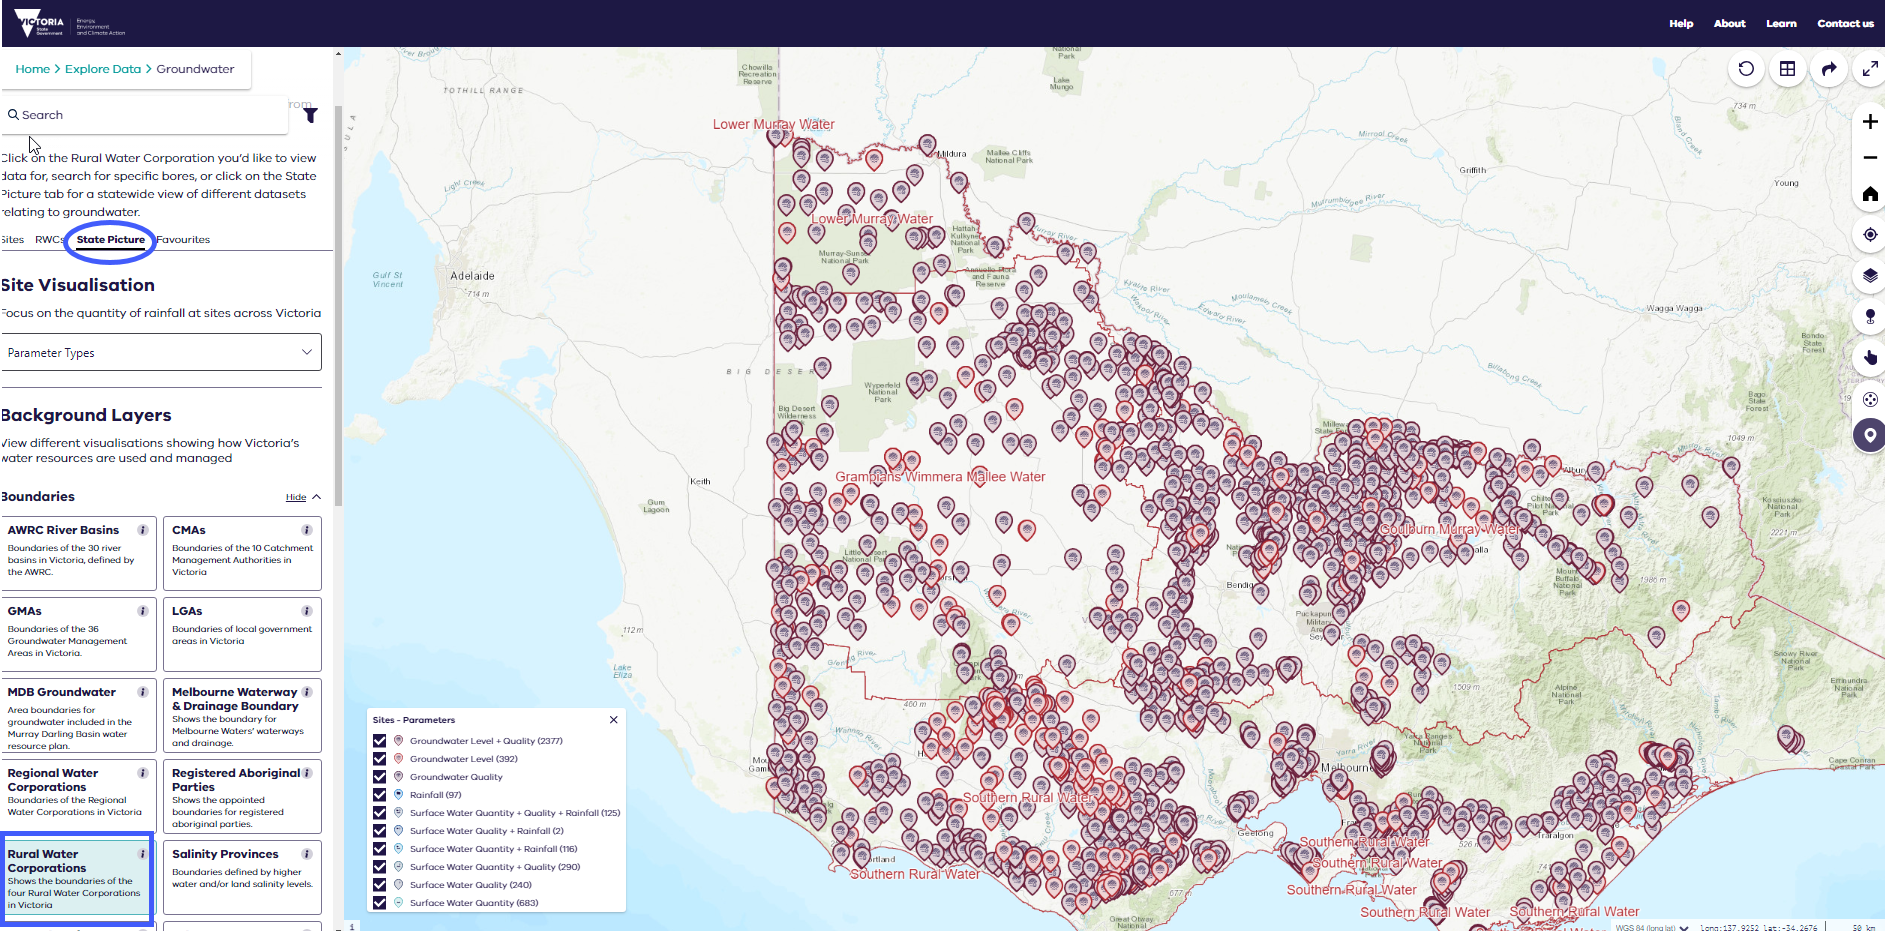
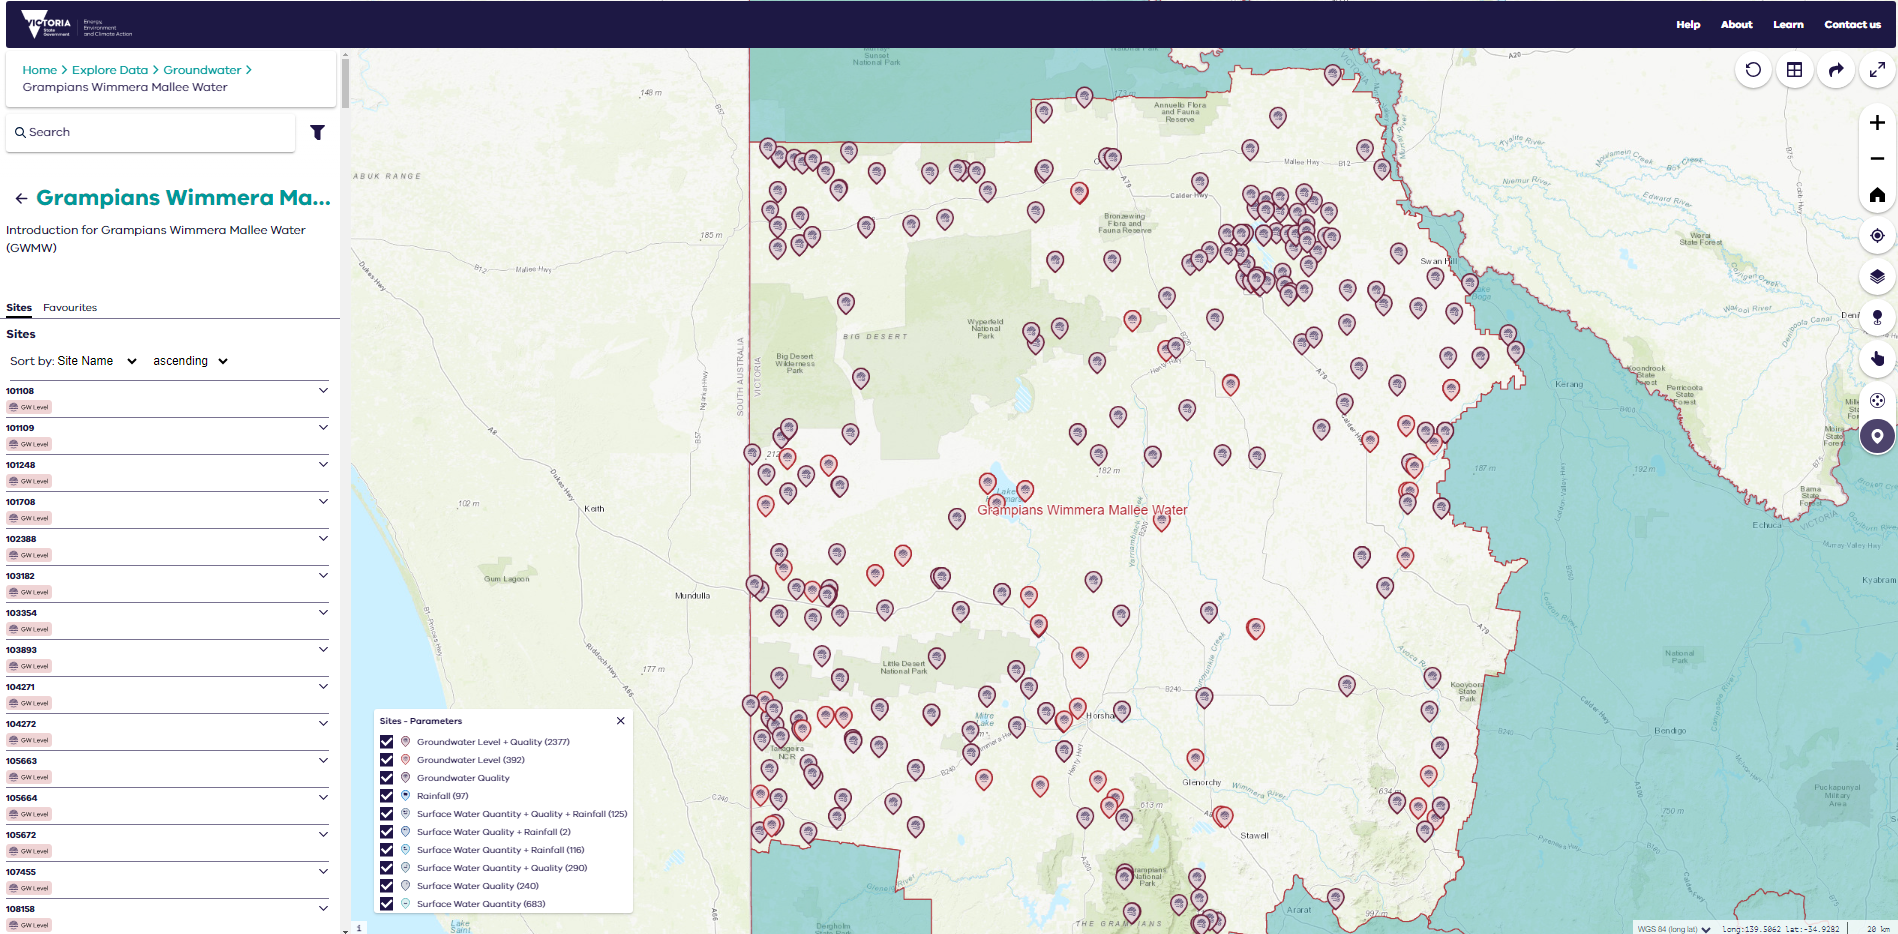
Left ‘mouse-click’ anywhere within the Grampians Wimmera Mallee Water boundary area to filter and zoom to this view.
Selecting sites in Grampians Wimmera Mallee Water service area
The sites within the Grampians Wimmera Mallee Water service area will display in the sidebar.
Sites within the Grampians Wimmera Mallee Water service area
Left ‘mouse-click’ on the view in table button.

The display will alter to provide a table view of the sites you’ve selected.
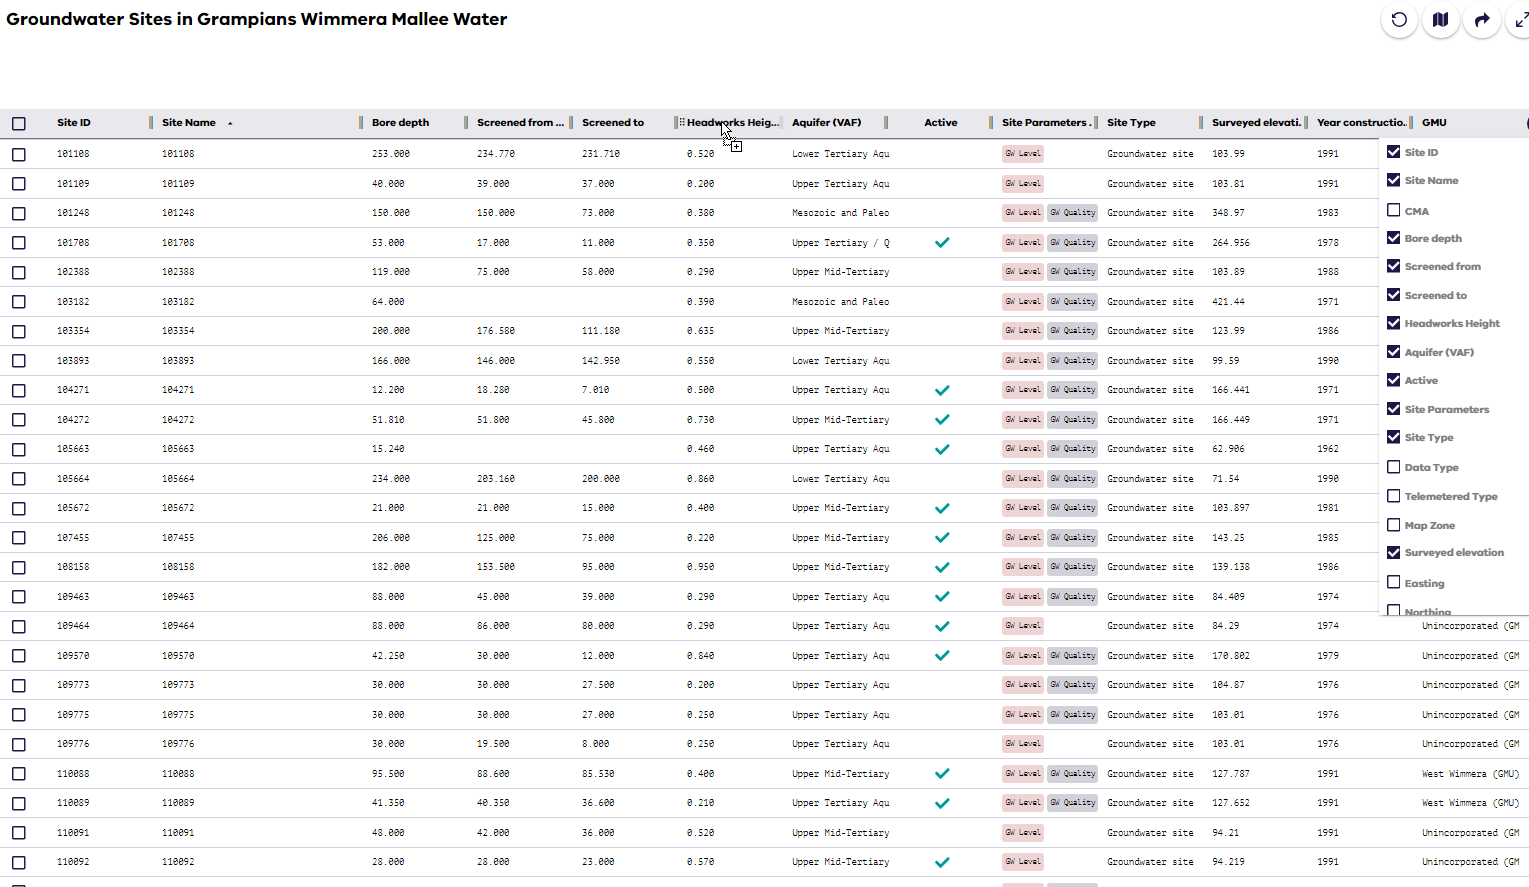
Table view of sites within Grampians Wimmera Mallee Water service area
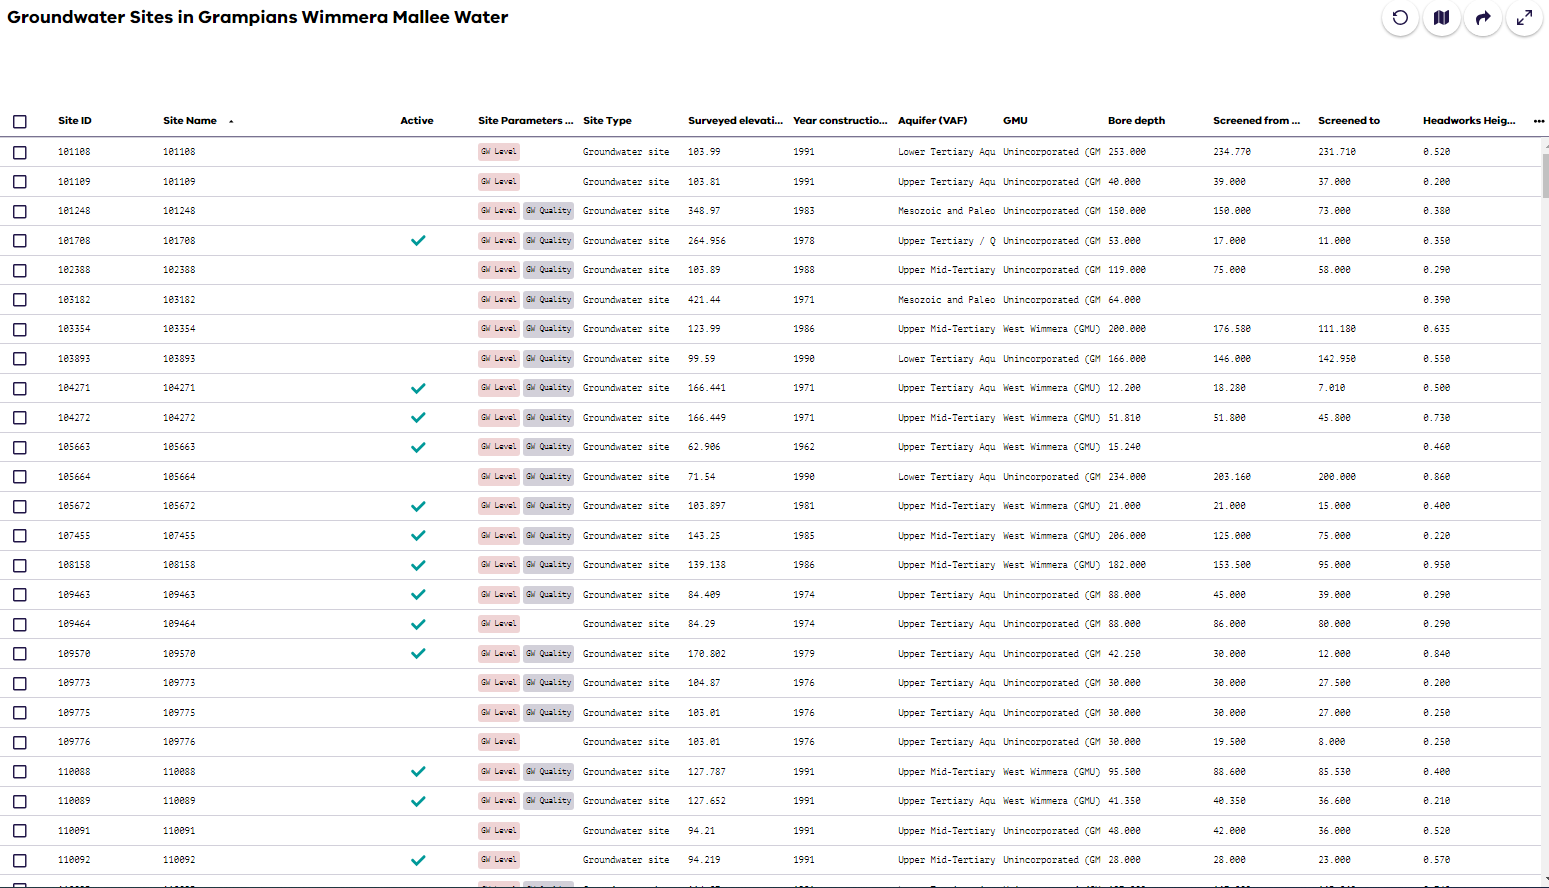
Left ‘mouse-click’ on the ellipsis to alter the displayed columns. The default column headers for groundwater are:
- site ID
- site name
- active
- site parameters
- site type
- surveyed elevation
- year construction date
- aquifer (VAF)
- GMU
- bore depth
- screened from
- screened to
- headworks height
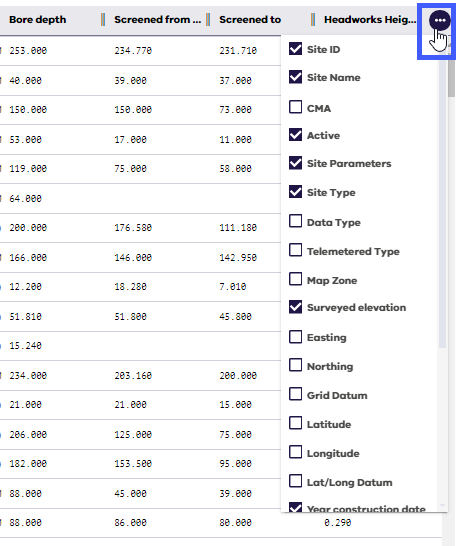
Other options include:
- CMA
- data type
- telemetered type
- map zone
- Easting
- Northing
- grid datum
- latitude
- longitude
- lat/long datum
- commence
- cease
Left 'mouse-click' on column header options to select/deselect.
The ellipsis dropdown showing the default displayed columns and other column options
Change the order of the columns by left ‘mouse-click’ and dragging and dropping. Note: Site ID is static.
Left ‘mouse-click’ on the sharing options button to display the sharing options.
Sharing options button selected and sharing options displayed
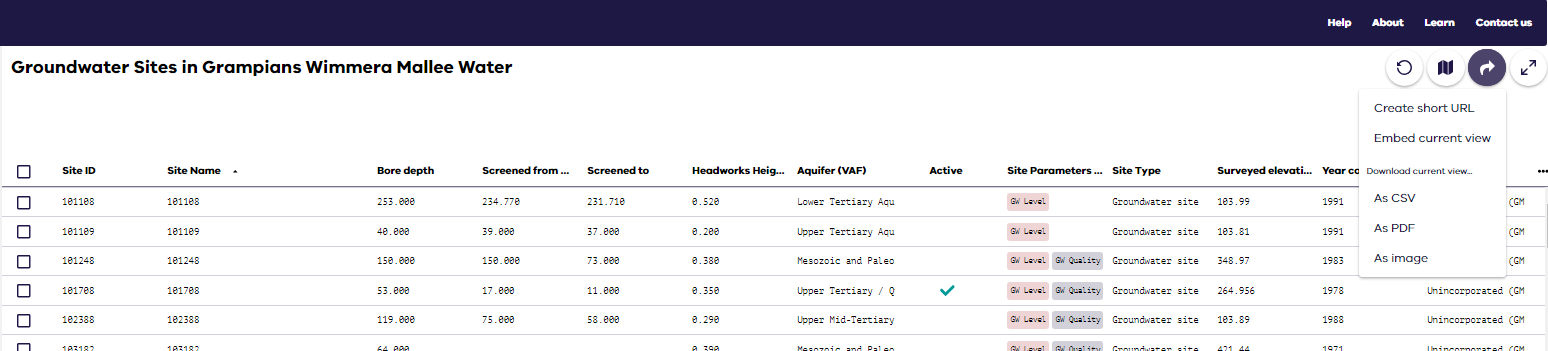
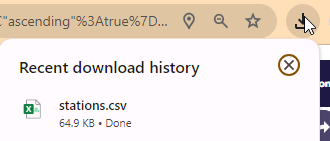
For this example the download type. as CSV is selected by left 'mouse-click'. The download is appear in the 'downloads' area of your website ribbon.
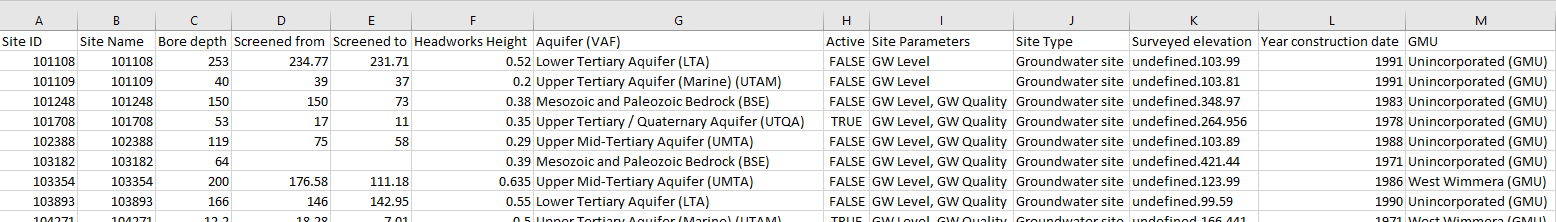
The column order of the csv file and data will be as per the display.
Download data
To download data, select the sites you want to download. For this example, the user wants to download all Rainfall data for the past 2 years.
Commencing from the Explore Data page left ‘mouse-click’ the filter sites button to activate the Advanced Filter.
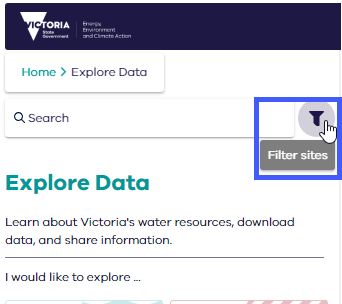
The advanced filter will appear.

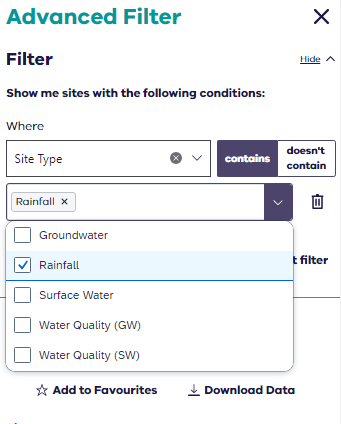
Left ‘mouse-click’ Site Type.
IMAGE NEEDS TO HAVE THE CIRCLE ADDED.
Left ‘mouse-click’ on the expander arrow and select 'rainfall'.
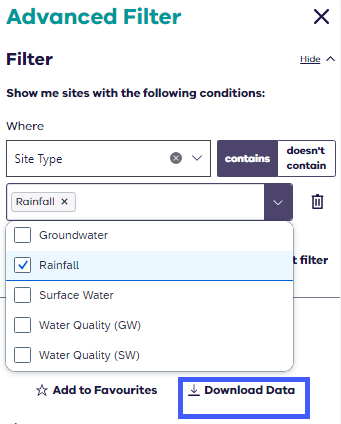
Left ‘mouse-click’ download data button.
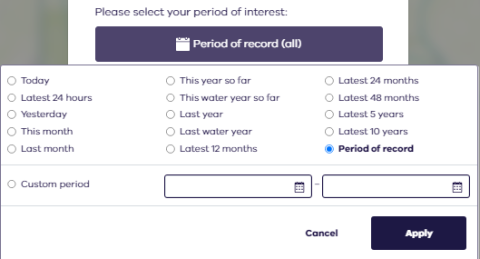
A download pop up appears. Select your chosen download format, add your email address, select your period of interest, and parameters.
The default is CSV format, but the user selects Excel format.
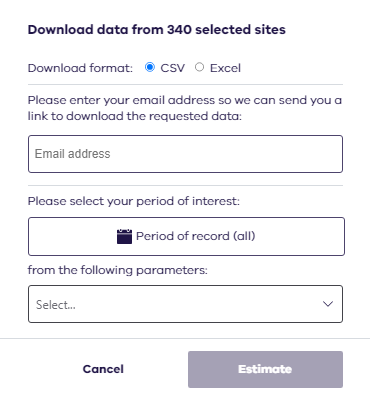
• The default is 'Period of record' but the user selects 'Latest 48 months'.
• All available parameters for the site will appear. The user only selects 'rainfall'.

After parameters are selected, choose the resolution for the data. The resolution type options are tailored for each parameter. The user selects 'daily total'.

Left ‘mouse-click’ the estimate button.

A pop up will temporarily display the estimated number of points. The number of points is within the single download amount for Excel format, hence the estimate button will change to 'download'. Left ‘mouse-click’ the download button.

A pop up will temporarily display the download summary. The download data display will remain to allow the user to download additional information in another download. If download is complete left 'mouse-click' on the cancel button. In this instance this option is selected.

Download everything
Should you need to download everything, we have a weekly update of all data. You can download the lot using this zip .
Reviewed 11 September 2024