
")
Most stream gauges do not measure streamflow directly. Rather, monitoring involves several steps:
- measuring water level (stage)
- periodically taking discharge measurements in the stream, known as gauging
- developing the relationship between water level (stage) and discharge for the site, a rating curve
- and applying this relation to the continuous stage record to compute streamflow (discharge).
Stream gauge installation with a bubbler system used to measure stream gauge (Credit: L.S. Coplin, USGS).
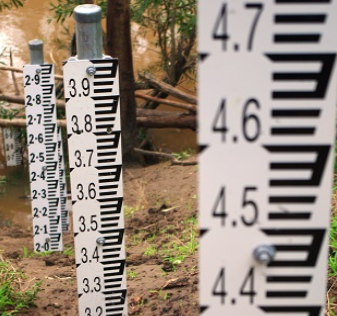
Step 1 - Measuring water level (stage)
Water level is measured using sensors and gauge boards. Water level sensors either measure the pressure or height of water above them, or the distance between the sensor and the water’s surface. The sensor data is then converted to a known water level by comparing the data to gauge boards installed at precisely surveyed heights on the riverbank. These level readings are stored in a data logger, typically at 15-minute intervals.
Where a site is on telemetry, this logged data is sent at hourly intervals to the DEECA websites. All other data is manually downloaded and analysed by a service provider on a routine schedule – typically once a month.
Types of water level sensors
-
Float and weight sensors, also known as encoders, work on the simple principle of a buoyant object rising and falling with the water level. A beaded wire connects the float and weight to a wheel on the level sensor, which rotates as the water level changes.
These installations use a stilling well to house the instruments and a horizontal inlet pipe to connect the waterway to the well. -
These include bubbler units and self-purge units, which measure water level by forcing an inert gas (typically nitrogen) through an orifice tube at a known pressure and rate and measure the force required to overcome the hydrostatic pressure of the water over the orifice opening. The more water over the orifice, the greater the force required for the gas to be pushed out.
-
Another type of level sensor are the differential pressure sensors – often referred to as wet level sensors in our network. These sensors measure water level by measuring the pressure of the water above the sensor in relation to the atmospheric air pressure at the site. To compensate for atmospheric changes in air pressure, most differential pressures have an air vent.
However, non-vented differential pressure sensors record total pressure (i.e. combined water level and atmospheric air pressure) and require a separate barometric sensor to record atmospheric air pressure which is then removed from the level trace through the data verification process. -
The last types of level sensor commonly used at our sites are non-contact radar and ultrasonic level sensors. These sensors are mounted directly above the waterway or at the bottom of a river channel and measure changes to water level in relation to the time it takes for a transmitted signal to be bounced back to the receiver.
These can be easily attached to bridges and walkways where excavation to install other sensor types is a challenge due to underground assets or where the area may be culturally significant.
Step 2 - Taking a gauging- discharge measurement
Streamflow, or discharge, refers to the volume of water moving through a waterway in a unit of time, commonly expressed in the RWMP as megalitres per day (ML/d). Taking direct measurements of streamflow can be difficult, and so it is more commonly calculated based on components that can be measured directly – water level, stream cross section and stream velocity.
This is done by multiplying the cross-sectional area of water (water level times waterway width) by the mean velocity.
")
Two of the most used techniques in the RWMP are the stationary velocity-area , and the moving boat method. All RWMP gaugings are completed in accordance with Australian or International Standards and the National Industry Guidelines for Hydrometric .
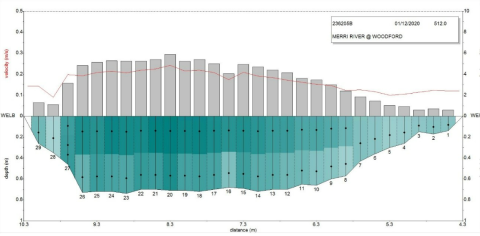
In the stationary velocity-area , the stream channel cross section is divided into horizontal subsections and an instrument is used to measure the velocity at in each subsection. Subsection velocities are multiplied by corresponding subsection areas; these values are summed to compute total discharge for the cross section.
There are two common instruments and techniques used to measure velocity in the RWMP: the mid-point method, and ADCPs that measure the vertical velocity profile at each section.
The mid-point method has each subsection measured for at least 40 seconds at 0.6 of the depth of the waterway at each subsection, or if the water is deep enough – at 0.8 of the depth and 0.2 of the depth. These depths have been found to be representative of the velocity profile of a subsection.
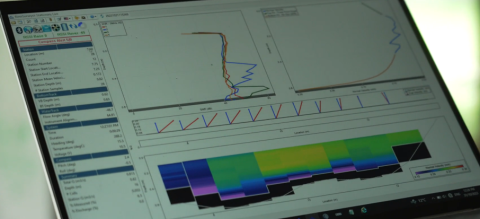
Measuring the entire vertical profile of each subsection is possible using ADCP instruments. ADCPs are hydroacoustic instruments that use the principles of the Doppler effect to measure water velocity by sending acoustic signals into the water and measuring the change in the frequency of the reflected signals back to the ADCP. The change in frequency, or Doppler shift, measured by the ADCP is then translated into water velocity. The ADCP provides a detailed vertical profile of water velocity and direction for each cross section, rather than limiting measurements to point locations within subsections of the stream channel. Having a full understanding of the velocity distribution across a gauging helps improve discharge measurement accuracy.
The other gauging method used in the RWMP is the moving boat method. ADCPs can collect velocity and depth data continuously as it moves horizontally across a waterway. This method of collecting gauging data is best suited to wider streams where it may be difficult to install infrastructure such as cableways or if dividing the waterway into sections may miss important gauging data.
Step 3 – Applying the rating curve (stage-discharge relationship)
A rating curve depicts the relationship between stream water level, in step 1, and streamflow, in step 2, at a location along a stream. Rating curves are developed from numerous stream discharge gauging measurements collected over time and over a range of water levels (from low flow to flood). Each point on the stage-discharge graph represents one discharge measurement.
The rating curve for almost every stream gauge will vary over time due to changes in the stream channel resulting from sedimentation, scour, debris, growth of aquatic vegetation, etc. To keep rating curves accurate and up-to-date, hydrographers visit each stream gauge periodically to make a discharge measurement. They also measure high flows whenever they occur. Each new revision or release of a rating table will have its own unique number (e.g. rating table 49.0) which helps keep track of these changes over time.
Most stage-discharge rating tables are plotted on logarithmic scales. This allows for a larger range of flows and water heights to be easily displayed on the single plot than if a linear scale was used.

Example of a rating curve showing the relation between water level (stage) and discharge for Snowy River at Jarrahmond (site 222200)
Calculating flow using directly measured velocities
Some sites have permanently installed flow meters that record near real time measurements of flow. These can be a mechanical flow meter or Acoustic Doppler Velocity Profilers (ADVP) and can be useful for directly measuring flow where conditions make a stage-discharge rating table impractical, such as in pipes or waterways where back up effects are present.
Mechanical flow meters are often used in channels and pipes and rotate at a factory calibrated rate of water flowing through the system. For example, a pipe water meter may have an internal fan which completes a full rotation every 5L of water. Discharge can then be calculated by counting the number of rotations over time (e.g. three rotations in 1min = 15L/min).
ADVPs can be permanently installed at a site to provide near real time measurements of velocity in a waterway. These devices still require inputs of water level and a known river area (cross section) to calculate flow but can be useful in determining flow where conditions are complex (e.g. tidal estuaries or irrigation channels).
A quick word on flow units
Our monitoring sites report flow in megalitres per day (ML/d). If a site provides a value of 10ML/d at 1pm, it doesn’t mean that 10 megalitres is flowing down the site at that point in time, it means that if the water level and flow stayed perfectly stable for 24hrs at that height, 10ML would have passed through the river. Daily flow figures will be an average of all data points collected across the 24-hour period.
Other common flow units are cubic metres per second (m3/s or cumecs) or litres per second (L/s).
These can all be converted back and forth from raw data as required, but it’s important to consider the number of significant figures or rounding required for your purpose. Litres per second provides data to a resolution that may be suitable for a seepage channel, but the value becomes difficult to report at the volumes of discharge seen in rivers.
Reviewed 08 July 2024